
Now that the Olympics have successfully come to a close, we are happy to see that the year-long delay wasn’t prolonged. We at Oakmark can relate with the athletes who had to maintain their patience and disciplined routines amid the uncertainty. We only wish our wait has been as short as theirs.
But starting last November, value started to see its day, outperforming growth once again. By the time the first quarter of 2021 ended, six out of seven Oakmark funds1 experienced their single best one-year returns of all time–receiving the proverbial gold medal for annual performance. And the lone excluded fund? It took silver, with its returns up 90%, ranking second out of 98 quarters in its history.
Table 1: Ranking Each Oakmark Fund One-Year Return Ending March 31, 2021 Relative to Its History
| Fund | Rolling One-Year Absolute Return | Historical Rank |
|---|---|---|
| Oakmark | 87.4% | 1 out of 115 quarters |
| Oakmark Select | 90.6% | 1 out of 94 quarters |
| Oakmark Global | 85.8% | 1 out of 83 quarters |
| Oakmark Global Select | 80.7% | 1 out of 54 quarters |
| Oakmark International | 84.8% | 1 out of 111 quarters |
| Oakmark International Small Cap | 89.8% | 2 out of 98 quarters |
| Oakmark Equity and Income | 53.7% | 1 out of 98 quarters |
Absolute return is the return that an asset achieves over a certain period and does not make any comparison against other possible investments or to a benchmark.
However, after a strong first two months of the second quarter, growth roared back in a record-setting June, dramatically outpacing value for the full quarter. And as of late, stock markets have fallen from their highs as the media’s obsession with the fast-spreading delta variant has frightened investors. So, is this the end of the value run?
Bill Nygren, Harris Associates Chief Investment Officer-U.S. Equities, recently weighed in on the subject on a quarterly shareholder call. “For those of you who are concerned that the value run might be over, clearly our funds have had an unusually good trailing year. But that outperformance wasn’t driven by a good relative period for value. The Russell Value and the Russell Growth Indexes each increased by similar amounts, 43.7% and 42.4% respectively, over the past year through June 30. So everything I’ve been talking about over the past year, highlighting what we believe is an unusually large opportunity to add value by focusing on stock price rather than just expected earnings growth, is just as valid today as it was then.”
After the strong one-year returns for value, it might be surprising to hear that valuations are still at historic lows for the price paid for value versus the price paid for growth. For example, European and global value indexes are trading at a 53% and 51% P/E discount to growth, respectively. Today’s levels are the lowest in over two decades, while the historic relationship is closer to a 30% discount.
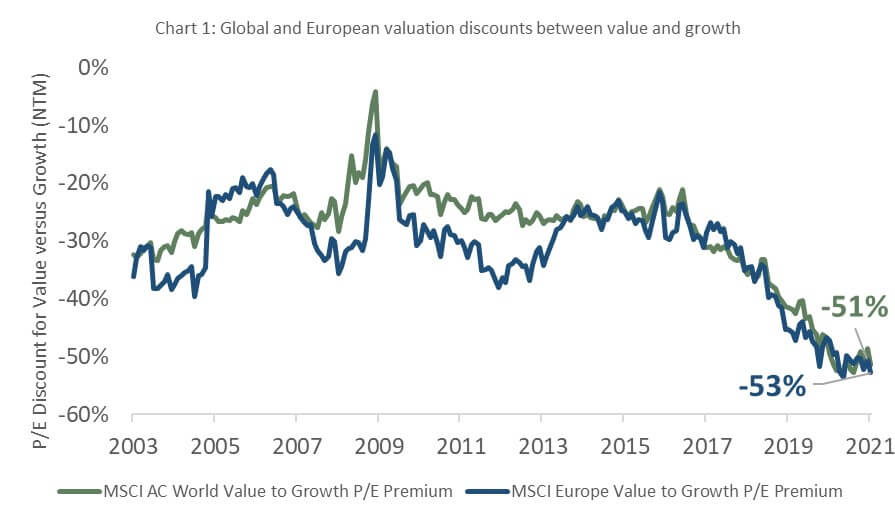
David Herro, Harris Associates Chief Investment Officer-International Equities, believes this gap between value and growth will close. “I expect to see pressure on interest rates benefit the greatest pocket of value—global financials. Other areas in the international market, including industrials and materials, are well placed to benefit from higher growth due to the reopening of national economics and further stimulus.”
At Oakmark, our investment team will keep its focus on measuring fundamental business value so we can keep score of the most attractive risk-rewards in the market. Our dialogue with management teams suggests they adeptly managed through the pandemic and their businesses are benefiting from the reopening of the global economy. Yet, the select businesses we own are still trading at significant discounts to our estimate of intrinsic value.
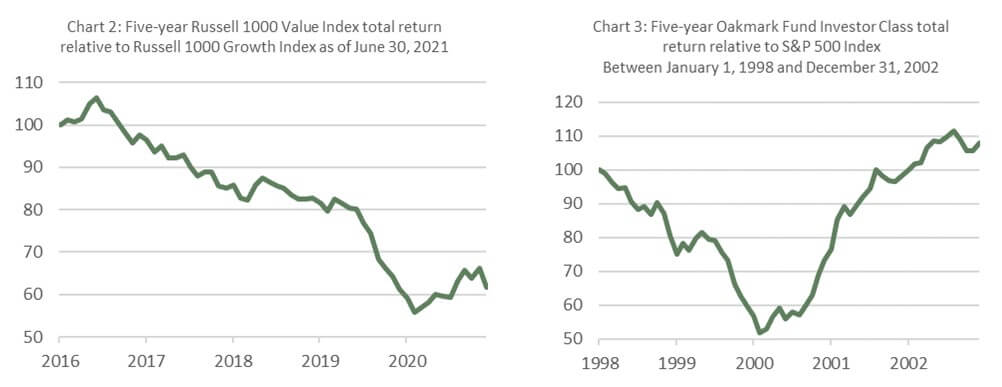
The relative returns of the Russell Value versus Russell Growth Indexes over the last five years still resemble the descent from the 10-meter diving platform (Chart 2). This time period reminds us of the internet bubble in 2000 when the Oakmark Fund outperformed the S&P 500 by 2100bps. But it wasn’t too late. Given the exuberance that built up the bubble, the Fund’s three-year trailing performance still lagged the S&P 500 by 3800bps. In 2001 and 2002, the Fund went on to outperform by another 3300bps (Chart 3). We think this is a similar situation because the magnitude of the slope was—and is—so steep. If the comparison holds, we believe our investors could be set up for similar relative performance in the years ahead.
We think the latest bout of uncertainty provides a great opportunity. We don’t believe investors should be underweight value going into an accelerating period of economic growth. At Oakmark, our experience suggests we are closer to the opening ceremony than the closing ceremony of the value recovery.
Go USA!
1As of March 31, 2021, the Oakmark Bond Fund didn’t have a one-year track record so it wasn’t included in this analysis.
Average Annual Total Returns (as of 03/31/2023):
| Fund | 3 Month | 1 Year | 3 Year | 5 Year | 10 Year | Inception |
|---|---|---|---|---|---|---|
| Oakmark Fund (Investor Class) | 8.10% | -3.82% | 26.81% | 9.67% | 11.71% | 12.36% |
| S&P 500 Total Return Index | 7.50% | -7.73% | 18.60% | 11.19% | 12.24% | 9.95% |
Expense Ratio: 0.89%
Fund Inception: 08/05/1991
To obtain most recent Oakmark Fund month-end performance data, view it here.
| Fund | 3 Month | 1 Year | 3 Year | 5 Year | 10 Year | Inception |
|---|---|---|---|---|---|---|
| Oakmark Select Fund (Investor Class) | 10.91% | -8.77% | 23.55% | 4.89% | 8.69% | 11.08% |
| S&P 500 Total Return Index | 7.50% | -7.73% | 18.60% | 11.19% | 12.24% | 8.91% |
Expense Ratio: 0.98%
Fund Inception: 11/01/1996
To obtain most recent Oakmark Select Fund month-end performance data, view it here.
| Fund | 3 Month | 1 Year | 3 Year | 5 Year | 10 Year | Inception |
|---|---|---|---|---|---|---|
| Oakmark Global Fund (Investor Class) | 10.54% | -2.69% | 22.26% | 5.11% | 7.39% | 9.32% |
| MSCI World Index | 7.73% | -7.02% | 16.40% | 8.01% | 8.85% | 5.44% |
Expense Ratio: 1.11%
Fund Inception: 08/04/1999
To obtain most recent Oakmark Global Fund month-end performance data, view it here.
| Fund | 3 Month | 1 Year | 3 Year | 5 Year | 10 Year | Inception |
|---|---|---|---|---|---|---|
| Oakmark Global Select Fund (Investor Class) | 9.10% | -8.93% | 18.02% | 3.82% | 7.27% | 7.13% |
| MSCI World Index | 7.73% | -7.02% | 16.40% | 8.01% | 8.85% | 6.44% |
Expense Ratio: 1.10%
Fund Inception: 10/02/2006
To obtain most recent Oakmark Global Select Fund month-end performance data, view it here.
| Fund | 3 Month | 1 Year | 3 Year | 5 Year | 10 Year | Inception |
|---|---|---|---|---|---|---|
| Oakmark International Fund (Investor Class) | 13.91% | 5.22% | 21.10% | 1.46% | 5.04% | 8.69% |
| MSCI World ex U.S. Index | 8.02% | -2.74% | 13.49% | 3.80% | 4.91% | 5.81% |
Expense Ratio: 1.04%
Fund Inception: 09/30/1992
To obtain most recent Oakmark International Fund month-end performance data, view it here.
| Fund | 3 Month | 1 Year | 3 Year | 5 Year | 10 Year | Inception |
|---|---|---|---|---|---|---|
| Oakmark International Small Cap Fund (Investor Class) | 6.56% | 2.78% | 22.71% | 3.49% | 5.60% | 8.47% |
| MSCI World ex U.S. Small Cap Index | 4.99% | -10.13% | 13.43% | 1.53% | 5.54% | N/A |
Expense Ratio: 1.34%
Fund Inception: 11/01/1995
To obtain most recent Oakmark International Small Cap Fund month-end performance data, view it here.
| Fund | 3 Month | 1 Year | 3 Year | 5 Year | 10 Year | Inception |
|---|---|---|---|---|---|---|
| Oakmark Equity and Income Fund (Investor Class) | 3.26% | -6.59% | 15.07% | 5.72% | 7.02% | 9.36% |
| Lipper Balanced Fund Index | 4.26% | -6.04% | 9.61% | 5.70% | 6.54% | 6.69% |
Expense Ratio: 0.83%
Fund Inception: 11/01/1995
To obtain most recent Oakmark Equity and Income Fund month-end performance data, view it here.
| Fund | 3 Month | 1 Year | 3 Year | 5 Year | 10 Year | Inception |
|---|---|---|---|---|---|---|
| Oakmark Bond Fund (Institutional Class) | 1.66% | -4.78% | N/A | N/A | N/A | -6.89% |
| Bloomberg Barclays U.S. Aggregate Bond Index | 2.96% | -4.78% | N/A | N/A | N/A | -7.70% |
Gross Expense Ratio: 1.64%
Net Expense Ratio: 0.74%
Fund Inception: 06/10/2020
To obtain most recent Oakmark Bond Fund month-end performance data, view it here.
Expense ratios are as of the Fund’s most recent prospectus dated January 28, 2023; actual expenses may vary.
Returns for periods of less than one year are not annualized.
The Oakmark Bond Fund’s Adviser has contractually undertaken to waive and/or reimburse certain fees and expenses so that the total annual operating expenses of each class are limited to 0.74%, 0.54%, 0.52% and 0.44% of average net assets, respectively. Each of these undertakings lasts until 01/27/2024 and may only be modified by mutual agreement of the parties. The Fund is recently established and has limited operating and performance history.
Past performance is no guarantee of future results. The performance data quoted represents past performance. Current performance may be lower or higher than the performance data quoted. The investment return and principal value vary so that an investor’s shares when redeemed may be worth more or less than the original cost. To obtain the most recent month-end performance data, view it here.
The price to earnings ratio (“P/E”) compares a company’s current share price to its per-share earnings. It may also be known as the “price multiple” or “earnings multiple”, and gives a general indication of how expensive or cheap a stock is. Investors should not base investment decisions on any single attribute or characteristic data point.
The MSCI All Country World Value Index (Net) captures large- and mid-cap securities exhibiting overall value style characteristics across Developed and Emerging Markets. The value investment style characteristics for index construction are defined using three variables: book value-to-price, 12-month forward earnings-to-price, and dividend yield. The Total Return Index (Net) includes reinvested dividends net of foreign withholding tax. This index is unmanaged and investors cannot invest directly in this index.
The MSCI Europe Value Index captures large and mid-cap securities exhibiting overall value style characteristics across the 15 Developed Market countries in Europe. The value investment style characteristics for index construction are defined using three variables: book value-to-price, 12-month forward earnings-to-price and dividend yield.
The Russell 1000® Value Index measures the performance of the large-cap value segment of the U.S. equity universe. It includes those Russell 1000® companies with lower price-to-book ratios and lower expected growth values. This index is unmanaged and investors cannot invest directly in this index.
The Russell 1000® Growth Index measures the performance of the large-cap growth segment of the U.S. equity universe. It includes those Russell 1000® companies with higher price-to-book ratios and higher forecasted growth values. This index is unmanaged and investors cannot invest directly in this index.
The S&P 500 Total Return Index is a float-adjusted, capitalization-weighted index of 500 U.S. large-capitalization stocks representing all major industries. It is a widely recognized index of broad, U.S. equity market performance. Returns reflect the reinvestment of dividends. This index is unmanaged and investors cannot invest directly in this index.
The MSCI World Index (Net) is a free float-adjusted, market capitalization-weighted index that is designed to measure the global equity market performance of developed markets. The index covers approximately 85% of the free float-adjusted market capitalization in each country. This benchmark calculates reinvested dividends net of withholding taxes. This index is unmanaged and investors cannot invest directly in this index.
The MSCI World ex U.S. Index (Net) is a free float-adjusted, market capitalization-weighted index that is designed to measure international developed market equity performance, excluding the U.S. The index covers approximately 85% of the free float-adjusted market capitalization in each country. This benchmark calculates reinvested dividends net of withholding taxes. This index is unmanaged and investors cannot invest directly in this index.
The MSCI World ex U.S. Small Cap Index (Net) is designed to measure performance of small-cap stocks across 22 of 23 Developed Markets (excluding the United States). The index covers approximately 14% of the free float-adjusted market capitalization in each country. This benchmark calculates reinvested dividends net of withholding taxes. This index is unmanaged and investors cannot invest directly in this index.
The Lipper Balanced Fund Index measures the equal-weighted performance of the 30 largest U.S. balanced funds as defined by Lipper. This index is unmanaged and investors cannot invest directly in this index.
The Bloomberg Barclays U.S. Aggregate Bond Index is a broad-based benchmark that measures the investment grade, U.S. dollar-denominated, fixed-rate taxable bond market. The index includes Treasuries, government-related and corporate securities, mortgage-backed securities (agency fixed-rate and hybrid ARM pass-throughs), asset-backed securities and commercial mortgage-backed securities (agency and non-agency). This index is unmanaged and investors cannot invest directly in this index.
The Oakmark, Oakmark Equity and Income, Oakmark Global, Oakmark International and Oakmark International Small Cap Funds’ portfolios tend to be invested in a relatively small number of stocks. As a result, the appreciation or depreciation of any one security held by the Fund will have a greater impact on the Funds’ net asset value than it would if the Fund invested in a larger number of securities. Although that strategy has the potential to generate attractive returns over time, it also increases the Funds’ volatility.
Because the Oakmark Select Fund and Oakmark Global Select Fund are non-diversified, the performance of each holding will have a greater impact on the fund’s total return, and may make the fund’s returns more volatile than a more diversified fund.
Oakmark Select Fund: The stocks of medium-sized companies tend to be more volatile than those of large companies and have underperformed the stocks of small and large companies during some periods.
The Oakmark Equity and Income Fund invests in medium- and lower-quality debt securities that have higher yield potential but present greater investment and credit risk than higher-quality securities. These risks may result in greater share price volatility. An economic downturn could severely disrupt the market in medium or lower grade debt securities and adversely affect the value of outstanding bonds and the ability of the issuers to repay principal and interest.
Oakmark Equity and Income Fund: The stocks of medium-sized companies tend to be more volatile than those of large companies and have underperformed the stocks of small and large companies during some periods.
The stocks of smaller companies often involve more risk than the stocks of larger companies. Stocks of small companies tend to be more volatile and have a smaller public market than stocks of larger companies. Small companies may have a shorter history of operations than larger companies, may not have as great an ability to raise additional capital and may have a less diversified product line, making them more susceptible to market pressure.
Investing in foreign securities presents risks that in some ways may be greater than U.S. investments. Those risks include: currency fluctuation; different regulation, accounting standards, trading practices and levels of available information; generally higher transaction costs; and political risks.
Investing in value stocks presents the risk that value stocks may fall out of favor with investors and underperform growth stocks during given periods.
The information, data, analyses, and opinions presented herein (including current investment themes, the portfolio managers’ research and investment process, and portfolio characteristics) are for informational purposes only and represent the investments and views of the portfolio managers and Harris Associates L.P. as of the date written and are subject to change and may change based on market and other conditions and without notice. This content is not a recommendation of or an offer to buy or sell a security and is not warranted to be correct, complete or accurate.
Certain comments herein are based on current expectations and are considered “forward-looking statements”. These forward looking statements reflect assumptions and analyses made by the portfolio managers and Harris Associates L.P. based on their experience and perception of historical trends, current conditions, expected future developments, and other factors they believe are relevant. Actual future results are subject to a number of investment and other risks and may prove to be different from expectations. Readers are cautioned not to place undue reliance on the forward-looking statements.
Daniel A. Nicholas, CFA
Client Portfolio Manager