Oakmark Bond Fund – Institutional Class
Average Annual Total Returns 03/31/22
Since Inception 06/10/20 0.26%
1-year -3.19%
3-month -5.19%
Gross Expense Ratio: 0.89%
Net Expense Ratio: 0.52%
Expense ratios are based on estimated amounts for the current fiscal year; actual expenses may vary.
The Fund’s Adviser has contractually undertaken to waive and/or reimburse certain fees and expenses so that the total annual operating expenses of each class are limited to 0.74%, 0.54%, 0.52% and 0.44% of average net assets, respectively. Each of these undertakings lasts until 1/27/2023 and may only be modified by mutual agreement of the parties.
Past performance is no guarantee of future results. The performance data quoted represents past performance. Current performance may be lower or higher than the performance data quoted. The investment return and principal value vary so that an investor’s shares when redeemed may be worth more or less than the original cost. To obtain the most recent month-end performance data, view it here.
To understand the Fed’s policies today, we need to understand the events that brought us here. In just the first decade of this century, there was a dot-com explosion, followed by a housing boom and bust, and then rounded off by a global financial crisis. Policymakers, confounded by both the severity and frequency of these economic events, searched for answers. That search led them to Japan and its Prime Minister Shinzo Abe who was garnering attention for fighting the ghosts of a deflationary past through a novel monetary policy called “quantitative easing.” The concept was fairly simple: A government could create new money and then use that newly minted money to buy financial instruments (typically bonds) in the open market. This in turn would lower interest rates, increase the amount of money in the system and ultimately stimulate economic growth. Facing a full systemic collapse in the wake of the global financial crisis, acting U.S. Federal Reserve Chairman Ben Bernanke took a chance and adopted the policy on November 25, 2008. The program, titled “QE1,” called for the Federal Reserve to purchase $600 billion in bank debt, U.S. Treasury notes and mortgage-backed securities (MBS) from member banks. At the time, no one understood just how historic that day was. Over the next decade, the Federal Reserve launched subsequent quantitative programs, including QE2, QE3, operation twist and QE4, totaling more than $2.5 trillion in stimulus.
Fast forward to March 2020, when the U.S. was hit with the once-in-a-century Covid-19 pandemic that halted the global economy. A full 12 years after “QE1,” the Federal Reserve acted with almost no hesitation and embarked on another quantitative easing plan that dwarfed any previous program. Even though the pandemic quantitative easing plan was orders of magnitude larger than anything the world had ever seen, market experts, pundits and passive participants welcomed it—even expected it—with limited scrutiny. Financial markets, awash in an unprecedented amount of liquidity, quickly found their footing, and over the next 18 months, investors enjoyed significant gains.
Chart 1: Stimulus Response to Global Financial Crisis vs. Covid-19 Crisis (1) (2)
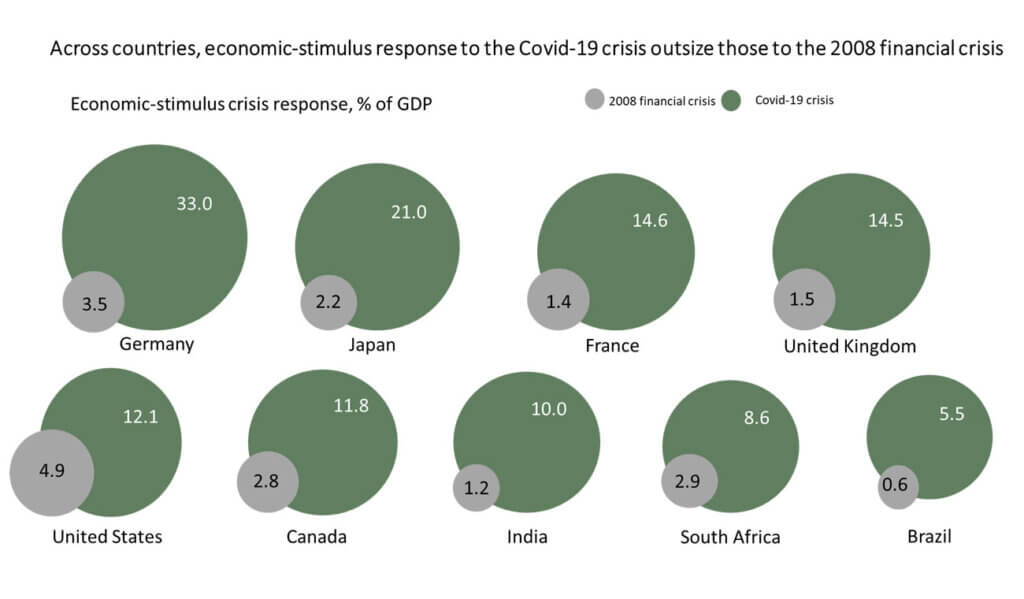
12019 GDP used as base for COVID 19, % of GDP calculation
2Source: International Monetary Fund, “Global economic policies and prospects”, March 2009
But as growth forecasts brightened and asset prices improved, liabilities quietly grew as well. Supply-chain shortages and labor imbalances were the first signs of trouble. By the second half of 2021, central bankers, as well as consumers, could see that inflation was the primary obstacle to further prosperity. Not only was it dangerously high, but it was also unrelenting. The limits of easy money policies that had gone on for more than two decades were finally being realized. Federal Reserve Chairman Jerome Powell and his counterparts around the globe had simply no other choice, and they began the largest and sharpest policy pivot in financial history. Policy normalization was underway for the third time this century.
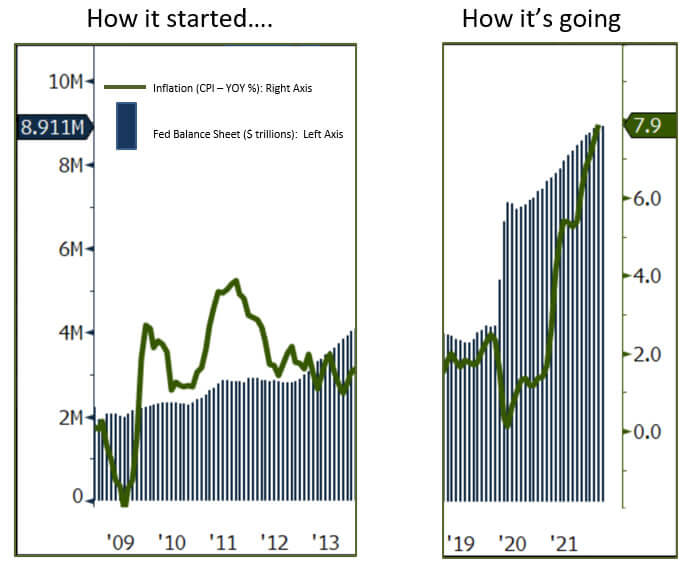
Today, inflation is sticky at 8%, most global growth indicators are slowing and the markets predict a 75% probability for a 50 basis points hike to the Fed Funds rate in May. The infamous 10s-versus-2 spread, a relatively accurate historical signal for economic recessions when it inverts, is currently inverted by three basis points. On top of that, the Ukrainian/Russian war threatens to further exacerbate inflation and supply-chain issues and it poses the threat of a broader, major world war. There is no reason to sugarcoat it. The risks to financial markets have increased quite significantly since our last letter.
We mentioned this on a recent podcast1, but one emerging risk we don’t think is getting enough coverage is just how little flexibility central banks have at the moment. The Federal Reserve has maximum flexibility during periods of moderate growth (1-3% real GDP growth) and benign inflation (inflation less than 3%). Other than the pandemic slowdown in 2020, that’s essentially been the prevailing profile of the U.S. since the global financial crisis. Under these “goldilocks” economic conditions, the Federal Reserve could opt to slowly raise rates to mitigate market excess, slowly lower rates to create an inflationary growth impulse or do absolutely nothing. Today, however, inflation is four to five times the last 20-year average, which means the market won’t have the luxury of leaning on a flexible Federal Reserve any time soon. Instead, the exact opposite of a “goldilocks” environment has been created by a kind of perfect storm of disrupted supply chains and trade, significantly higher food and energy prices, tighter financial conditions, and lower business and consumer confidence. Now, growth threatens to be too cold, while inflation remains too hot.
Increased risks don’t necessarily mean doom and gloom for markets, however. The recovery in the U.S. and other developed economies has been shaken by a few punches, but it is still upright. Although economic growth forecasts are decreasing, the U.S. economy can still grow 1.5%-2.5% in the remaining three quarters of the year. Moreover, our bottom-up research suggests our Fund’s holdings remain fundamentally solid; a majority now boast net leverage (net debt versus profitability) that has returned to pre-pandemic levels and equity cushions that have grown. Their interest coverage (profitability versus interest costs) and free-cash-flow-to-debt are also up quite significantly versus 2019.
In summary, investors should expect more volatility as the interplay between aggressive central bank policies, inflationary forces and growth continues for the remainder of the year. The Ukrainian/Russian war, depending on both the length and possible resolution, also poses significant risks that are very difficult to handicap. Regardless, the Federal Reserve cannot pivot to a more supportive policy stance if growth decelerates more quickly than expected or if the war escalates. Investors who have grown used to the Fed backstop should not count on it this time around. Fortunately, U.S. corporations are arguably more creditworthy than before the pandemic, and cash flow and valuation cushions will make them more resilient as we face cycle headwinds. Consumers are also in relatively good shape due to a savings build-up over the last several years. For all of these reasons, we recommend turning down the volume on doomsayers predicting a near-term default cycle or major recession. However, we do recognize that a larger number of variables are generating a wider set of outcomes and producing a thicker cloud of uncertainty than financial markets have faced since the spring of 2020. As we navigate the fog, we will prioritize portfolio flexibility and look for compelling opportunities if or when market pricing detaches from our values.
MARKET OUTLOOK AND POSITIONING
Performance and Outlook
The Oakmark Bond Fund returned -5.19% in the first quarter ending March 31, 2022, and generated 74 basis points of excess returns versus its benchmark, the Bloomberg Barclays U.S. Aggregate Index. Inception-to-date performance was 0.26% through March 31, 2022, generating excess return against the benchmark of 351 basis points on an annualized basis.
The Fund’s outperformance in the quarter was driven by the Fund’s curve positioning in our government allocation and our overall short duration position versus the index. Specifically, curve flattening and significantly higher rates translated to relative gains given our current barbell approach to curve positioning in U.S. Treasurys and our overall portfolio duration of 5.4 years versus our peers and index averages of 6.2 and 6.7, respectively. Although our relative overweight in corporate credit was a detractor to performance as credit spreads widened, our security selection continues to serve as a tailwind to attribution versus the index. Our strongest contributors included securities issued by T-Mobile, Parsley Energy, Marriott and Kraton. Our largest detractors from selection came from securities issued by Ally Financial, Brunswick Corporation, NXP Semiconductors and Aercap.
Outlook and Positioning
As highlighted above, credit markets may weaken further if the Ukrainian/Russian war escalates or if central banks enact tighter policies to combat heightened inflationary pressures. As a result, our credit positioning remains focused on resiliency, liquidity and principal preservation in anticipation of a wide array of scenarios. However, this is not a time to be idle. In fact, quite the opposite. Amid the largest quarterly sell-off in the core plus funds on record, we picked up activity in the Fund. Toward the end of the quarter, we actively began to reposition out of our shorter duration Treasury and credit and into longer duration corporate credit and structured products. Going forward, we see the potential to increase spread risk opportunistically in our portfolios, but with a preference for quality. We recognize the possibility of a “wider set of outcomes, across a wider set of variables.” As a result, we are prepared to rotate into credit risk, but in a cautious, measured manner. With such a highly uncertain environment, we are broadening the ranges of inputs into our base case model, focusing on our downside cases, and prioritizing hard asset value, good collateral and visible cash flows.
1Griffin, Graham. “Value Investing Live Recap: Adam Abbas.” GuruFocus, https://www.gurufocus.com/news/1638694/value-investing-live-recap-adam-abbas. Accessed February 9, 2022.
The securities mentioned above comprise the following preliminary percentages of the Oakmark Bond Fund’s total net assets as of 03/31/22: Aercap 1.1%, Ally Financial 1.6%, Brunswick Corporation 1.1%, Kraton 0%, Marriott 1.3%, NXP Semiconductors 1.0%, Parsley Energy 1.7% and T-Mobile 0%. Portfolio holdings are subject to change without notice and are not intended as recommendations of individual stocks.
Access the full list of holdings for the Oakmark Bond Fund as of the most recent quarter-end.
The Bloomberg Barclays U.S. Aggregate Bond Index is a broad-based benchmark that measures the investment grade, U.S. dollar-denominated, fixed-rate taxable bond market. The index includes Treasurys, government-related and corporate securities, mortgage-backed securities (agency fixed-rate and hybrid ARM pass-throughs), asset-backed securities and commercial mortgage-backed securities (agency and non-agency). This index is unmanaged and investors cannot invest directly in this index.
The Oakmark Bond Fund invests primarily in a diversified portfolio of bonds and other fixed-income securities. These include, but are not limited to, investment grade corporate bonds; U.S. or non-U.S.-government and government-related obligations (such as, U.S. Treasury securities); below investment-grade corporate bonds; agency mortgage backed-securities; commercial mortgage- and asset-backed securities; senior loans (such as, leveraged loans, bank loans, covenant lite loans, and/or floating rate loans); assignments; restricted securities (e.g., Rule 144A securities); and other fixed and floating rate instruments. The Fund may invest up to 20% of its assets in equity securities, such as common stocks and preferred stocks. The Fund may also hold cash or short-term debt securities from time to time and for temporary defensive purposes.
New Fund Risk: The Fund is recently established and has limited operating history. The Fund may not be successful in implementing its investment strategy.
Under normal market conditions, the Fund invests at least 25% of its assets in investment-grade fixed-income securities and may invest up to 35% of its assets in below investment-grade fixed-income securities (commonly known as “high-yield” or “junk bonds”).
Fixed income risks include interest-rate and credit risk. Typically, when interest rates rise, there is a corresponding decline in bond values. Credit risk refers to the possibility that the bond issuer will not be able to make principal and interest payments.
Bond values fluctuate in price so the value of your investment can go down depending on market conditions.
The information, data, analyses, and opinions presented herein (including current investment themes, the portfolio managers’ research and investment process, and portfolio characteristics) are for informational purposes only and represent the investments and views of the portfolio managers and Harris Associates L.P. as of the date written and are subject to change and may change based on market and other conditions and without notice. This content is not a recommendation of or an offer to buy or sell a security and is not warranted to be correct, complete or accurate.
Certain comments herein are based on current expectations and are considered “forward-looking statements”. These forward looking statements reflect assumptions and analyses made by the portfolio managers and Harris Associates L.P. based on their experience and perception of historical trends, current conditions, expected future developments, and other factors they believe are relevant. Actual future results are subject to a number of investment and other risks and may prove to be different from expectations. Readers are cautioned not to place undue reliance on the forward-looking statements.
All information provided is as of 03/31/2022 unless otherwise specified.