We have been fielding questions about the nature of the new positions in the Oakmark International Fund over the last couple of quarters and whether this is a conscious repositioning toward “quality” and/or are we doing something different. Spoiler alert: Yes, the portfolio has higher aspects of quality and no, we have not changed who we are as value investors. Quality is in many ways in the eye of the beholder. First, let’s start by defining quality, then we will get to whether we are intentionally shifting into higher quality businesses and if so, why now.
If you want to get technical, quality as a portfolio factor consists of five sub-factors: earnings quality (think cash conversion), earnings variability (earnings beta), leverage (debt relative to earnings and assets), investment (return on growth investments) and profitability (return on assets and margins). We don’t disagree that high cash conversion, low earnings volatility, low leverage, ample high return investment opportunities, and high returns/margins are proxies for quality when looking at a business.
You may be wondering if there’s general agreement on what quality is and that it has value, where is the disagreement that makes for an imperfect market? The first is an investor’s time horizon and how that might affect one’s view of the outlook for a business. Each quality metric uses well known GAAP/IFRS financial accounting metrics as shortcuts for rating quality. By the time these metrics are reported, they are history. So, investors need to consider whether past is prologue. Namely, is the direction of travel in the fundamental drivers of business quality stable, moving in the right or wrong direction and why. If temporary cyclical headwinds are weighing down profits, perhaps there is an opportunity for an investor like Harris | Oakmark that uses a longer time horizon. If there is good reason to believe there is a quality business hidden by years of mismanagement and there is change afoot, maybe the “quality” of the business is likely to improve. Or perhaps a company is making a large investment that we believe will have future pay off, but is penal to the balance sheet, margins and returns today. You get the idea. As investors we all want more, not less, quality—Harris | Oakmark included. However, facts and circumstances might be temporarily masking or flattering quality metrics in such a way that investors with different time horizons come to different conclusions on quality.
The second area of controversy on quality is price. That is whether and to what degree price discipline is applied by the investor in search of quality. At Harris | Oakmark, we have elected to have a high bar on price. We demand a significant discount to our estimate of intrinsic value, defined as the present value of future cash flows. Let’s make up some numbers to illustrate how this works in practice for us. Imagine there is a 10-point quality scale and higher is better. Company A has a quality score of 9 and Company B is ranked as an 8 in a quantitative factor model with similarly positive outlooks. Company B is selling for half our estimate of intrinsic value and Company A at 95%. Both are technically undervalued and higher than average quality, but only one would make the grade for a Harris | Oakmark portfolio (Company B). As you know, we care about quality and rank all our companies on a general business quality scale. We would love to own nothing but the best in quality, but it would have to meet our threshold on price. We take this approach in seeking to protect us and our fellow investors (you) from downside risk if we are wrong in our assessment of the company and share in the excess return if we are correct. At Harris | Oakmark, we seek quality, but as a value manager we require an attractive entry price.
I promised I would get to whether quality is on the rise in the portfolio and why now. The short answer is yes; the Oakmark International Fund has a relatively higher proportion of capital invested in companies with higher profitability, lower leverage and less volatile earnings streams than it did a year ago. Although we have always maintained an affinity for quality, prices for quality have recently become more attractive on a relative basis so our bottom-up process led us there. In many ways, 2025 was a banner year for equity markets across the globe. Believe it or not, one group of stocks left behind was quality companies with more stable earnings, higher returns and lower leverage. This isn’t uncommon when positive returns are everywhere. Quantitative firm AQR reports more than 20 years of a “long quality, short junk” (low quality) factor model for Europe. 2025 is shaping up to be the worst year for high quality relative to low quality since 2009 when we rallied coming out of The Great Recession. The chart is below, please note these are average monthly returns by year so annualized numbers are much larger.
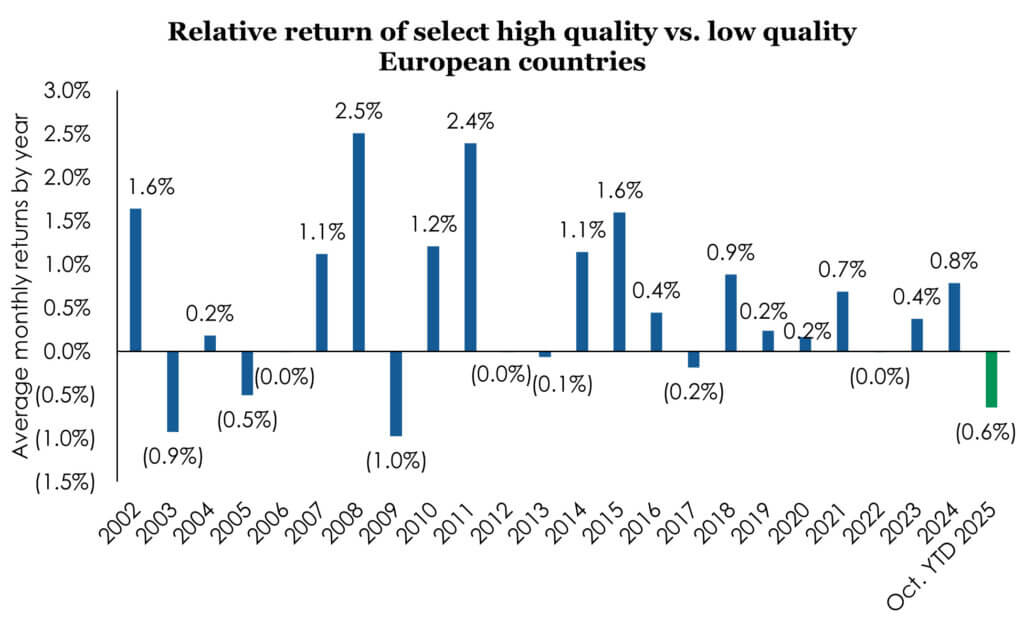
Source: Data sourced from AQR’s Quality Minus Junk (QMJ) factor model, as of 10/31/25. QMJ portfolios are an updated and extended version of the equity portfolios used in Asness, Frazzini and Lasse H. Pedersen, 2014, “Quality Minus Junk,” working paper. QMJ is AQR’s quality-minus-junk factor that goes long high quality stocks and short low quality stocks. The quality score is the average of four aspects of quality: profitability, growth, safety and payout. European Equity Markets include Austria, Belgium, Denmark, Finland, France, Germany, Greece, Ireland, Italy, Netherlands, Norway, Portugal, Spain, Sweden, Switzerland, United Kingdom. Data reflects the average monthly return by year. Past performance is no guarantee of future results. Chart is for informational purposes only and does not depict the performance of any Harris | Oakmark strategy or product.
Below is another cut of similar data showing the relative outperformance or (underperformance) of quality to the Stoxx 600 by quarter, again on an average monthly return basis.
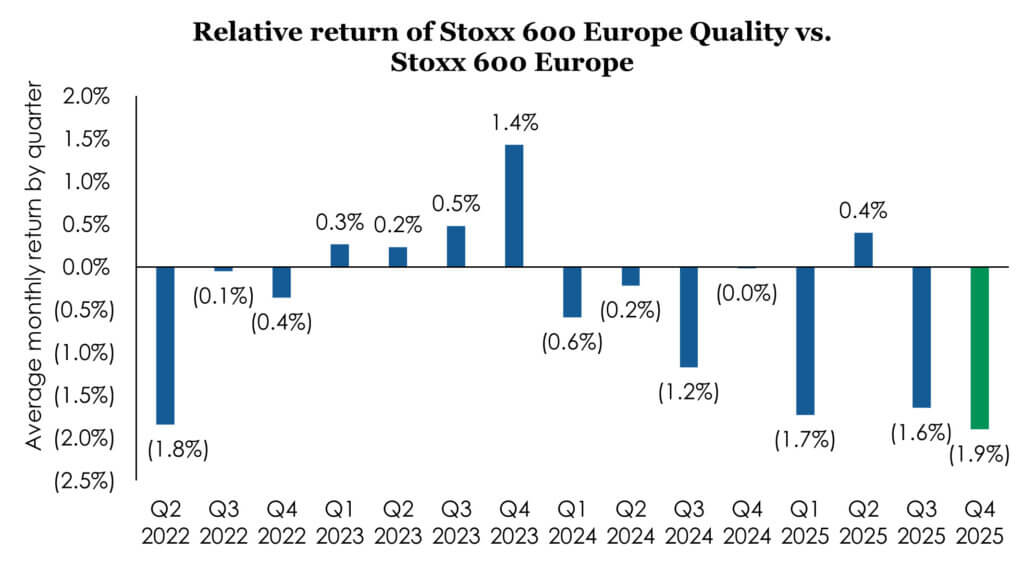
Source: FactSet, as of 12/31/25. Indices shown: Stoxx 600 Europe Ax Quality Index, Stoxx 600 Europe Index. Past performance is no guarantee of future results. Chart is for informational purposes only and does not depict the performance of any Harris | Oakmark strategy or product.
You can clearly see 2025 was an awful year for quality even relative to the average European stock not just low quality, and 2024 wasn’t that great either. After two bad years, we are finding some nice values among quality businesses. This isn’t us changing our stripes, but rather the market shifting—and us leveraging our time-tested value approach to capitalize on current opportunities.
Notes from the road
I recently returned from two weeks in Asia split evenly between Japan and Korea with Eric Liu and Doug Fagan who do a terrific job covering Japan and Korea for us. We met with 70 companies over 10 business days.
Starting with Japan, there certainly is more capital bringing an outside perspective to what has been a relatively insular country economically. Over the last decade the number of activist funds operating in Japan has increased roughly ten times and private equity transaction levels are up four times. This encourages more discipline on capital allocation decisions and use of benchmarking when evaluating operational performance to determine what good looks like. That said, our meetings indicated to me that 1) we are partnered with management teams that truly care about shareholders and 2) there is still a long way to go until management teams more broadly are as focused on value creation as they are in the west. Regarding the latter, while most companies have a medium-term plan to return capital and enhance return on equity, the plans are rote, and most management teams didn’t seem to understand the why behind them nor did they base them on benchmarking. Instead, most just pick slightly higher numbers and most haven’t met their goals from nearly three years ago. An improvement, but at a glacial pace.
Korea has been a fast follower. The government has been busy legislating enhancements to shareholder rights, and most companies now have a “value-up” plan whereby they commit to certain capital return and operating goals. Companies outside of Chaebol control—the family-controlled conglomerates that dominate South Korea’s economy—such as the banks we own, have more fully embraced the concept, but the Chaebols will take some time. There are serious conflicts around control vs. ownership and the interplay with succession, inheritance and tax policy. With the KOSPI Index up around 79% in 2025, values are up, so in some regards it is mission accomplished! That said, with the market selling for less than 11x forward earnings, there is still a Korean discount and the prospect of that being unwound over the next several years remains promising.
New ETFs
We launched two new ETFs late this quarter to meet client needs even better: the Oakmark International Large Cap ETF (OAKI) and the Oakmark Global Large Cap ETF (OAKG). Learn more about the ETFs in our press release. Many thanks to our dedicated employees for making this possible operationally and our new partners who bought the funds.
We don’t do new products at Harris | Oakmark if the partners aren’t eager to invest themselves. Know that the managers on these strategies supported the launch of the new ETFs personally.
We are eager to hear from you so please do not be shy.
Thank you for your partnership with us in our international equity portfolios.
OPINION PIECE. PLEASE SEE ENDNOTES FOR IMPORTANT DISCLOSURES.
Important Disclosures
This material is not intended to be a recommendation or investment advice, does not constitute a solicitation to buy, sell or hold a security or an investment strategy, and is not provided in a fiduciary capacity. The information provided does not take into account the specific objectives or circumstances of any particular investor, or suggest any specific course of action. Investment decisions should be made based on an investor’s objectives and circumstances and in consultation with his or her financial professionals.
The information, data, analyses, and opinions presented herein (including current investment themes, the portfolio managers’ research and investment process, and portfolio characteristics) are for informational purposes only and represent the investments and views of the portfolio managers and Harris Associates L.P. as of the date written and are subject to change and may change based on market and other conditions and without notice. This content is not a recommendation of or an offer to buy or sell a security and is not warranted to be correct, complete or accurate.
Certain comments herein are based on current expectations and are considered “forward-looking statements.” These forward-looking statements reflect assumptions and analyses made by the portfolio managers and Harris Associates L.P. based on their experience and perception of historical trends, current conditions, expected future developments, and other factors they believe are relevant. Actual future results are subject to a number of investment and other risks and may prove to be different from expectations. Readers are cautioned not to place undue reliance on the forward-looking statements.
The STOXX Europe 600, also called STOXX 600, SXXP, is a stock index of European stocks designed by STOXX Ltd. This index has a fixed number of 600 components representing large, mid and small capitalization companies among 17 European countries, covering approximately 90% of the free-float market capitalization of the European stock market. This index is unmanaged and investors cannot invest directly in this index.
The Korea Composite Stock Price Index or KOSPI is the index of all common stocks traded on the Stock Market Division—previously, Korea Stock Exchange—of the Korea Exchange. It is the representative stock market index of South Korea, analogous to the S&P 500 in the United States. This index is unmanaged and investors cannot invest directly in this index.
Investing involves risk; principal loss is possible. There is no guarantee the Fund’s investment objective will be achieved. Value stocks may fall out of favor with investors and underperform growth stocks during given periods. Foreign securities presents risks that in some ways may be greater than investments in U.S. investments. Those risks include: currency fluctuation; different regulation, accounting standards, trading practices and levels of available information; generally higher transaction costs; and political risks. The Fund’s portfolio tends to be invested in a relatively small number of stocks. As a result, the appreciation or depreciation of any one security held by the Fund will have a greater impact on the Fund’s net asset value than it would if the Fund invested in a larger number of securities. Although that strategy has the potential to generate attractive returns over time, it also increases the Fund’s volatility. These and other risk considerations are described in detail in the Fund’s prospectus.
All information provided is as of 12/31/2025 unless otherwise specified.