By Adam Abbas, Portfolio Manager
Key Takeaways:
- Short-term events like the Federal Reserve’s actions, inflation trends and economic growth metrics seldom affect the foundational aspects of the long-term investment landscape.
- Regardless of whether inflation remains at 3% or reverts to 2%, the long-term investment outlook for fixed income remains positive.
- Periods of high volatility are more often precursors to higher future returns.
- Fixed income can act as a shock absorber in a downturn and provide higher income in a stable-rate environment – which enhances the expected returns.
When I was starting out at Lehman Brothers, I found out a certain famous bond investor ignored the daily financial news that I, as a new analyst, was told to follow closely. This puzzled me initially, considering how much the media drives the market. But I eventually understood why. As I progressed in my career and increasingly leaned into long-term value investing, I understood why the renowned bond investor chose to ignore the daily financial noise, recognizing it as a potential distraction rather than a benefit. Today, the daily news churn pores over the Fed’s moves, inflation and economic growth. While these are important short term, they don’t really shake the long-term investment ground.
Take, for example, whether the Fed cuts rates in June or August, or if the CPI slightly changes; neither will drastically alter the long-term outlook for bonds. These details help predict market trends or price discovery in the short term, but they should never be allowed to eclipse the larger, long-term investment picture.
Our Chief Investment Officer-U.S., Bill Nygren, aptly stated in his Q1 2021 investment memo, “We believe we can take advantage of [market inefficiencies] by forecasting further into the future and by unemotionally pursuing opportunities where other investors have overreacted.” In that vein, in this commentary I will avoid the emotional pull of speculating on short run rates and inflation forecasts and replace that with a little bit of dispassionate bond math. I hope after some number crunching, I can demonstrate how today’s bond market is more resilient than those of recent years and how high real and nominal yields set the stage for resilient expected returns for patient capital.
The misconception of perpetually high inflation preventing fixed income investments
The inflation debate – whether it’s sticky and remains high or continues its descent toward the Fed’s objective – certainly captures a lot of headlines. Some think ongoing budget deficits and changes in population and technology will keep inflation around 3%. Others believe the recent increase is just a blip and expect it to drop back to 2% soon. My take? The answer is probably somewhere in the middle. But here’s what really matters for investors: no matter if inflation sticks at 3% or falls to 2%, it doesn’t really change the game for bond investing.
Now, let’s dive into the data and make simple assumptions to compare these scenarios with historical performance:
Figure 1: Expected Real Returns for Buy and Hold to Maturity
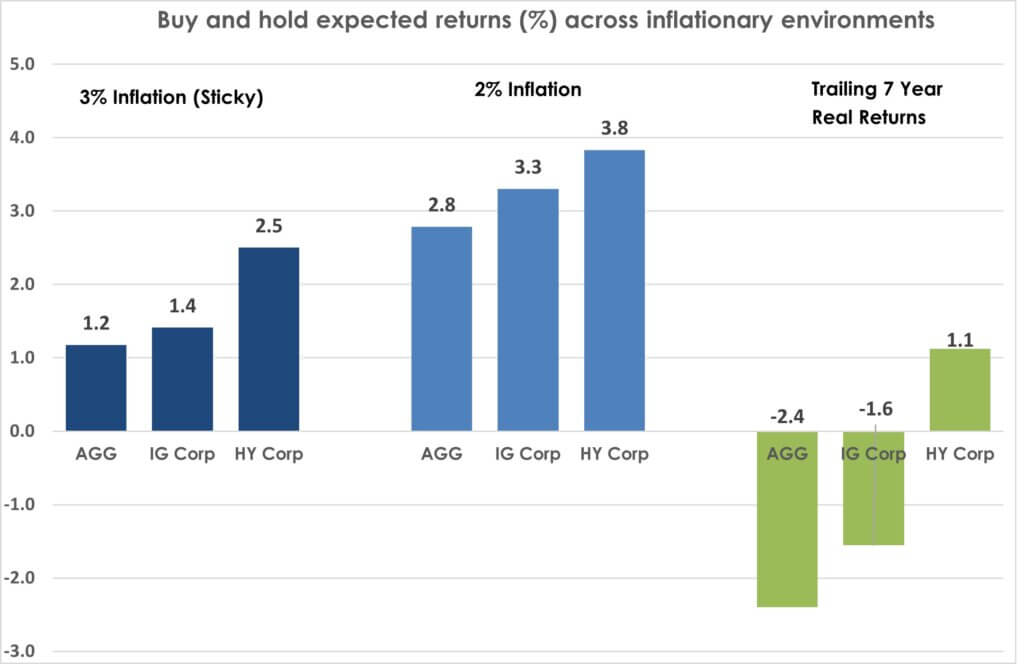
Data source: Bloomberg, 4/1/2004-3/31/2024. AGG is the Bloomberg U.S. Aggregate Bond Index; IG Corp Index is the Bloomberg U.S. Investment Grade Corporate Bond Index; HY Corp is the Bloomberg U.S. High Yield Corporate Bond Index. Data assumes historical average default rate and recovery for each index averages the historical normalized default rate (20 year). Nominal rates normalize to account for inflation scenario over 18-month period. Real returns set by nominal returns after loss average defaults and average recoveries minus inflation scenario (3% sticky or 2% target met). Assume seven-year life of holding period and all assets held to maturity or reinvested at 3/31/24 stated effective index yield.
Figure 2: Nominal total expected returns are relatively high versus recent history realized returns given much higher starting yields, thereby creating a more resilient total return. Inflation holding at 3% or at 2% should not meaningfully change outcomes assuming a normal default backdrop and hold to maturity.
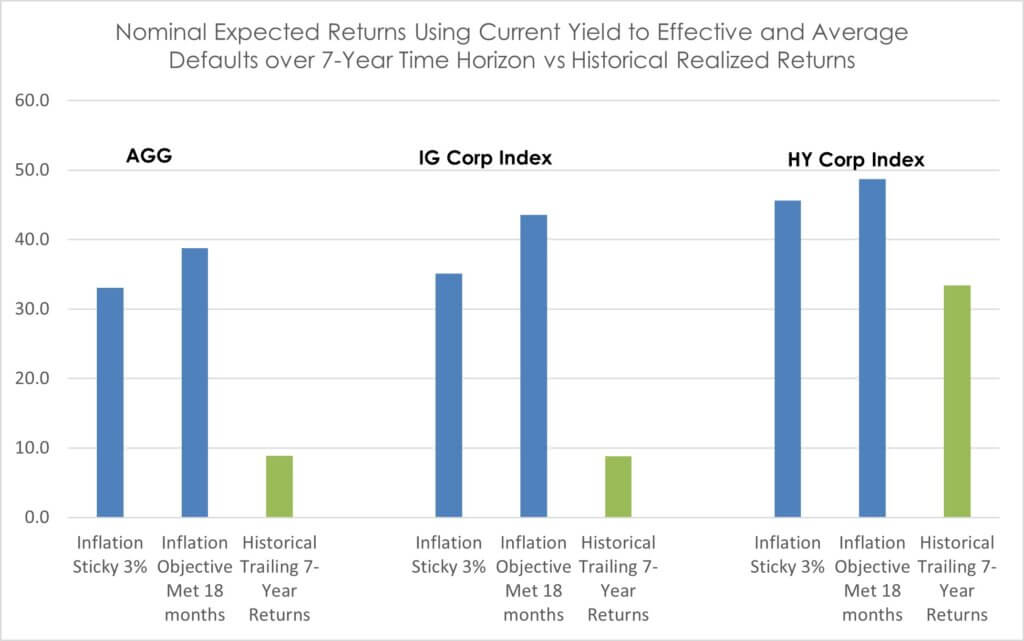
Data source: Bloomberg, from 4/1/2004 to 3/31/2024. AGG is the Bloomberg Aggregate Bond Index; IG Corp Index is the Bloomberg U.S. Investment Grade Corporate Bond Index; HY Corp Index is the Bloomberg U.S. High Yield Corporate Bond Index. Data assumes historical average default rate and recovery for each index averages the historical normalized default rate (20 year). Nominal rates normalize to account for inflation scenario over 18-month period. Real returns set by nominal returns after loss average defaults and average recoveries minus inflation scenario (3% sticky or 2% target met). Assume a 7-year life of holding period and all assets held to maturity or reinvested at 3/31/24 stated effective index yield.
As Figure 1 shows, whether 3% or 2%, realized inflation will not fundamentally shift the attractiveness of fixed income as a long-term investment. By choosing to invest in fixed income securities and holding them to maturity, investors can capitalize on current high nominal and real yields. When we look ahead to the next seven years and compare it with the past seven, the appeal of these yields becomes increasingly apparent. The central point here is that, absent a significant economic setback, investors who engage in a long-term, buy-and-hold strategy can expect inflation-adjusted returns to be much higher than those experienced in the recent era of low-interest rates.
Navigating rate volatility and market uncertainty
Another recurring concern popularly broadcast as rates move higher is that the volatility and uncertainty in interest rate markets make fixed income “un-investible”. Whenever I see uncertainty or volatility as reasons to not invest, I remind myself that markets will always have a degree of uncertainty and that volatility as measured by things like the VIX or rate swings doesn’t mean poor returns. Actually, periods of high swings in prices are often a predictor of above average future returns.
Higher yields usually mean better returns down the line. It’s pretty straightforward, and the data below supports this idea. Look at the graph comparing rate volatility to future returns in the investment grade corporate bond market.
Figure 3: Rate volatility after spikes have been a signal for above-historical forward returns
Rate Volatility (in black, left axis) vs the Investment Grade Bond Total Return (in dark green, right axis)
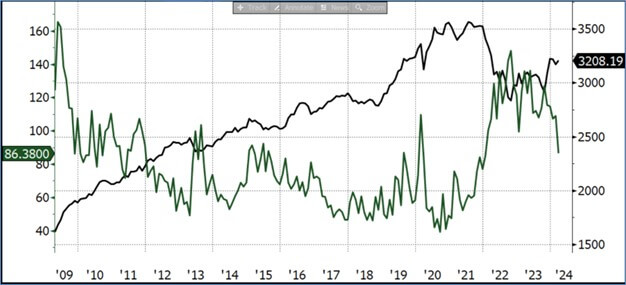
Source: Merrill Lynch and Bloomberg, as of 3/31/2024. Volatility is represented by Merrill Lynch Option Volatility Estimate Index (MOVE index). Investment Grade Bond Total Return is represented by Bloomberg Investment Grade Corporate Bond Fund Index.
Figure 4: Investment grade corporate bond 1-, 3- and 7-year forward returns after peaks in rate volatility and sustained high levels of market uncertainty.
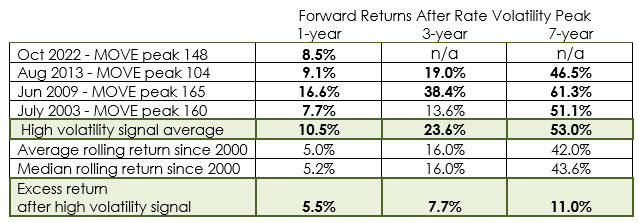
Source: Bloomberg and Merrill Lynch, as of 3/31/2024. Volatility/MOVE is represented by Merrill Lynch Option Volatility Estimate Index (MOVE Index). Investment Grade Bond Total Return is represented by Bloomberg Investment Grade Corporate Bond Fund Index
As you can see from the graph and table, after a period of high volatility, we can expect better-than-average returns over one, three, and seven years. As fixed income investors, we must remember that uncertainty is a constant in investing, regardless of the current economic situation. Even amid wars, central bank actions or fluctuations in valuation and sentiment, the reliability of fixed income assets remains strong. The assurance of regular interest payments and the return of principal at maturity highlight the stability these investments offer.
Credit valuations: Are they too expensive?
The final criticism dominating headlines today regarding the bond market is about credit valuations. Specifically, the question on everyone’s mind is: Are they too expensive?
Credit spreads provide extra yield to compensate investors for the risks linked to bankruptcy. It’s increasingly common to argue that these spreads are currently too expensive or “tight,” suggesting potential overvaluation. However, focusing solely on credit spread valuations in a vacuum (versus historical levels) without considering significantly higher starting nominal and real rates overlooks a crucial aspect of generating returns in this interest rate regime compared to the last. While it’s important to begin with current credit spread valuations and assess their implications for future default rates and recoveries, we must also recognize the role of elevated real rates during downturns and their protective cushion for returns. Also, we need to incorporate the impact of higher starting yields and income.
To tackle this, we created a model that incorporates all three factors: spreads, real rates and all-in yields. We also apply historical correlations to real rates and credit spreads to help model the resiliency of cushion that elevated levels today will provide in a slowdown. To help frame richness or cheapness, we then solve for the number of defaults needed to create average real returns. If those defaults are significantly higher than history, we can point to fundamental cheapness.
Figure 5: Required Annualized Defaults Needed to Experience Average Historical Returns Over 7-Year Life.
Assumes Real Rates Normalize over Time and Inflation Stabilizes at Elevated Level of 3%
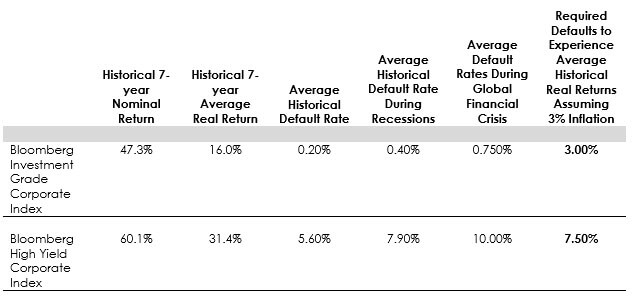
Source: Bloomberg, 7-year rolling returns,4/1/1994-3/31/2024. Data assumes: Real rates normalize to 50 bps over 3.5-year period. For each 1% in assumed defaults, data assumes an increase of 50 bps of credit spread in year one and year two. Nominal yields are set by last period real rate plus credit spread. Assumes normalization back down to average historical credit spread in year three and year four, and average historical recoveries in defaults. Uses 7-year average rolling CPI for real yield historical calculations.
From the calculations, it’s apparent that current high yields give investors a significant buffer against potential losses, despite narrow credit spreads. For example, conservative estimates show that investment-grade corporates could withstand defaults nearly four times the historical average and still yield average historical real returns for buy-and-hold investors over seven years. Similarly, while not as pronounced, high yield investors have a substantial safety margin compared to historical default rates to secure average real returns after accounting for inflation.
How can this be, especially when credit spreads are perceived as “rich” or “tight,” ranking in the top decile historically? The answer lies partly in the current state of real yields, which are 150-200 basis points above the post-global financial crisis average. During economic slowdowns, real yields typically move inversely to credit spreads and can dip significantly during recessions. Presently, with real yields around 180-200 basis points in the five- and seven-year segments of the curve, they are poised to act as a far superior buffer in case of a severe economic downturn, compared to previous slowdowns in the low-rate era when real yields were negative. Moreover, these elevated real yields offer an extra 180-200 basis points of income carry, adding a cushion as we navigate through the end of the current rate hike cycle. This dual benefit—acting as a shock absorber in a downturn and providing higher income in a stable-rate environment—enhances the expected returns for fixed income asset classes. Investors focusing solely on credit spreads and historical comparisons are overlooking these crucial factors, which are necessary to accurately assess the relative value and attractiveness of credit investments in the market environment.
The case for a long-term investing view
Despite the transient uncertainties and fluctuations in the market, our long-term investment philosophy underscores the value of fixed income for generating stable returns over extended periods. The tendency to focus on daily market movements and to hang on every word from central bank officials should be moderated. Acknowledging the return potential and inherent resilience of fixed income instead—particularly when yields are favorable, capital is patient, and time horizons are long—is paramount.
Yes, the risks of short-term rate and credit valuation fluctuations exist, but at Harris Oakmark, we focus on the enduring risk-adjusted value proposition of fixed income over a five- to seven-year horizon. We remain opportunistic and ready to enhance our preferred positions when conditions align. Meanwhile, we encourage investors to appreciate the steady income that fixed income investments can provide, reinforcing the foundation for a well-rounded portfolio.
OPINION PIECE. PLEASE SEE ENDNOTES FOR IMPORTANT DISCLOSURES.
The information, data, analyses, and opinions presented herein (including current investment themes, the portfolio managers’ research and investment process, and portfolio characteristics) are for informational purposes only and represent the investments and views of the portfolio managers and Harris Associates L.P. as of the date written and are subject to change and may change based on market and other conditions and without notice. This content is not a recommendation of or an offer to buy or sell a security and is not warranted to be correct, complete or accurate.
Certain comments herein are based on current expectations and are considered “forward-looking statements.” These forward looking statements reflect assumptions and analyses made by the portfolio managers and Harris Associates L.P. based on their experience and perception of historical trends, current conditions, expected future developments, and other factors they believe are relevant. Actual future results are subject to a number of investment and other risks and may prove to be different from expectations. Readers are cautioned not to place undue reliance on the forward-looking statements.
Yield is the annual rate of return of an investment paid in dividends or interest, expressed as a percentage. A snapshot of a fund’s interest and dividend income, yield is expressed as a percentage of a fund’s net asset value, is based on income earned over a certain time period and is annualized, or projected, for the coming year.
Maturity is the weighted average of the stated time to maturity for the securities held in the portfolio.
The Bloomberg U.S. Aggregate Bond Index is a broad-based benchmark that measures the investment grade, U.S. dollar-denominated, fixed-rate taxable bond market. The index includes Treasuries, government-related and corporate securities, mortgage-backed securities (agency fixed-rate and hybrid ARM pass-throughs), asset-backed securities and commercial mortgage-backed securities (agency and non-agency). This index is unmanaged and investors cannot invest directly in this index.
Bloomberg U.S. Investment Grade Corporate Bond Index: measures the investment grade, fixed-rate, taxable corporate bond market. It includes USD denominated securities publicly issued by US and non-US industrial, utility, and financial issuers.
Bloomberg U.S. High Yield Corporate Bond Index: measures the USD-denominated, high yield, fixed-rate corporate bond market. Securities are classified as high yield if the middle rating of Moody’s, Fitch and S&P is Ba1/BB+/BB+ or below. Bonds from issuers with an emerging markets country of risk, based on the indices’ EM country definition, are excluded.
Merrill Lynch Option Volatility Estimate Index (MOVE index): The MOVE index is a market-implied measure of bond market volatility. The MOVE index calculates the implied volatility of U.S. Treasury options using a weighted average of option prices on Treasury futures across multiple maturities (2, 5, 10, and 30 years).
Bloomberg Investment Grade Corporate Bond Fund Index: a fund that mimics the composition and performance of the Bloomberg Investment Grade Corporate Bond Index.
The Oakmark Bond Fund invests primarily in a diversified portfolio of bonds and other fixed-income securities. These include, but are not limited to, investment grade corporate bonds; U.S. or non-U.S.-government and government-related obligations (such as, U.S. Treasury securities); below investment-grade corporate bonds; agency mortgage backed-securities; commercial mortgage- and asset-backed securities; senior loans (such as, leveraged loans, bank loans, covenant lite loans, and/or floating rate loans); assignments; restricted securities (e.g., Rule 144A securities); and other fixed and floating rate instruments. The Fund may invest up to 20% of its assets in equity securities, such as common stocks and preferred stocks. The Fund may also hold cash or short-term debt securities from time to time and for temporary defensive purposes.
Under normal market conditions, the Fund invests at least 25% of its assets in investment-grade fixed-income securities and may invest up to 35% of its assets in below investment-grade fixed-income securities (commonly known as “high-yield” or “junk bonds”).
Fixed income risks include interest-rate and credit risk. Typically, when interest rates rise, there is a corresponding decline in bond values. Credit risk refers to the possibility that the bond issuer will not be able to make principal and interest payments.
Bond values fluctuate in price so the value of your investment can go down depending on market conditions.
All information provided is as of 03/31/2024 unless otherwise specified.