By Adam Abbas, Portfolio Manager
We’re celebrating the three-year mark of the Oakmark Bond Fund. This milestone offers a chance to look back, analyze and plan. As our esteemed colleague Bill Nygren so aptly said during the 25th anniversary of the Oakmark Fund, “As anniversaries are a time for reflection, let’s look at some of the things we can learn from a 25-year ‘season’ rather than focusing on just the past quarter or year.”
In light of this perspective, we are still in the early stages of our “season.” At three years, we are far short of the quarter-century that Bill wrote about. Nevertheless, we heed the wisdom of his words, and we are using this commentary as an opportunity to consider more than just the immediate fluctuations of the market and instead examine the longer, more revealing course. We’ll review how past financial crises have proven the resilience of certain asset classes, the shifting yields in the bond market, and our journey with the Fund while we also look ahead. To all of our investors, both current and prospective, we want to thank you for believing in our vision.
From Bricks to Bonds: The Resurgence of Asset Classes
The great financial crisis was the outcome of years of bad loans and unchecked betting, which pumped up house prices. The devastating consequences cast a long shadow over the U.S. housing market. For years after, plenty of investors and media outlets declared the real estate market as good as dead. Doubts loomed large. Could the sector ever recover from such a heavy blow? Indeed, the so-called “dead” market bounced back strongly and proved the naysayers wrong.
Like a neighborhood picking up the pieces after a bad storm, the housing market brushed off its troubles and mapped a steady path to recovery. Those who turned their backs on the residential real estate asset class in 2008 might have felt smug when housing prices continued to sag in 2009, 2010 and 2011. However, they then missed out on a spectacular decade-long rally that cumulatively returned 138%–or 8.9% a year.1 This amazing comeback reinforces a timeless truth: even when faced with major setbacks, traditional asset classes maintain their lasting value.
In our three-year tenure with the Oakmark Bond Fund, we’ve observed a parallel evolution. Bonds, a traditionally stalwart component of diversified portfolios, have encountered skepticism akin to the post-2008 financial crisis. Suspicions that once tainted the real estate market now loom over bonds’ role in balanced portfolios. The once sacrosanct place of fixed income as an asset class now faces scrutiny.
Skeptics have raised valid concerns. In the post-global financial crisis era, the bond market has experienced remarkable turbulence, testing the mettle of investors. Drawing parallels with the housing crisis—which suffered due to a flood of high-risk mortgages—the bond markets’ current troubles stem largely from loose, unchecked policies. Specifically, extremely loose monetary and fiscal policies have shackled bond yields close to zero for most of the past decade, engendering uncertainty about future returns. Out of necessity—for income, for volatility buffering or simply under the notion of a lack of alternatives—investors have held onto bonds. However, as we entered 2022, the rapid normalization of interest rates led to substantial losses, shattering already shaky trust and fostering doubts about the enduring relevance of fixed income assets. Voices from various corners of the financial commentary world have amplified the predicted demise of bonds, especially within the traditional 60/40 asset allocation model. Yet, as we cross into the second half of 2023, there are emerging signs of a transformation within the bond asset class that critics can’t easily dismiss.
As bonds begin to disentangle themselves from central bank influences and as governmental policies relax their stranglehold, bond yields are moving substantially higher compared to the low interest rate era. Nominal yields, depending on the fixed income asset, now offer between 1.5x to 3x their average from the previous decade. Real rates—adjusted for inflation—are now in positive territory, a phenomenon we haven’t witnessed since the financial crisis.
Our advice? Don’t abandon bonds. Instead, let’s draw wisdom from past upheavals and recognize that these bedrock asset classes tend to demonstrate their importance precisely when they appear most vulnerable. At Oakmark, we don’t aspire to be fortune tellers who can predict market fluctuations. Our approach is anchored in the conviction that fundamental value will eventually prevail over short-term, non-fundamental pressures. Imagine the bond market’s journey as a play, and remember that the most gratifying scenes often follow challenging plot twists. As the curtain on the easy money era finally falls, our cue is not to exit the theater but to eagerly anticipate the next act.
The Upcoming Act – From “Lean” to “Mean;” the Yield Environment Has Shifted
In 2023, the financial terrain has shifted significantly. The past decade, which was distinguished by “easy money” and near-zero yields, is slowly being replaced by a period of rigorous monetary policies and appealing bond yields. We are transitioning from what we’ve coined the “lean yield era” into the “mean yield era.” This isn’t to suggest that bond yields have taken an aggressive turn and have become hostile (although they could justifiably feel marginalized after the last decade). Instead, we’re indicating a shift from historically low yields toward a period of average or “mean” yields, evoking memories of the pre-global financial crisis era as the influence of the government and Federal Reserve on yields diminishes.
Figure 1: From Lean (Yield) to Mean: Bond Yields, After More Than A Decade of Low Yields, Are Finally Back Through the 25 Year Mean
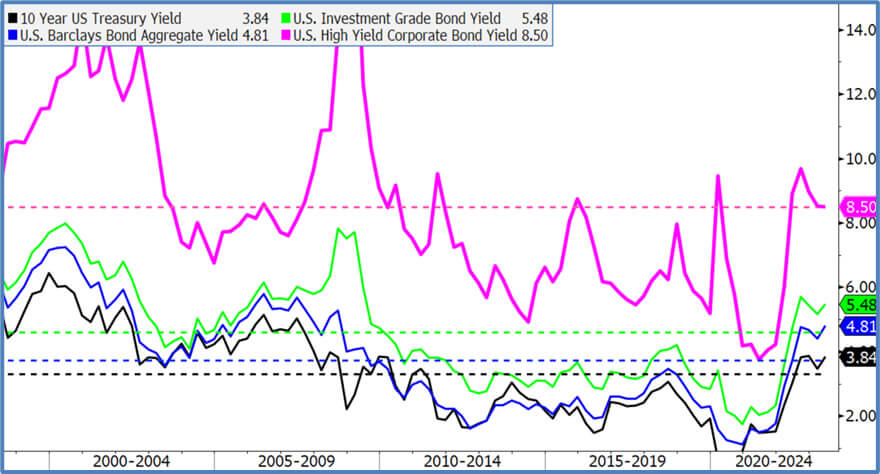
1) In Black: 10-Year US Treasury Yield = Bloomberg 10-Year U.S. Treasury Yield Index
2) In Blue: U.S. Barclays Bond Aggregate Yield = Bloomberg/Barclays U.S. Aggregate Bond Index
3) In Green: U.S. Investment Grade Bond Yield = Bloomberg U.S. Corporate Bond (investment grade) Index
4) In Purple: U.S. High Yield Corporate Bond Yield = Bloomberg U.S. Corporate High Yield Index
Source: Bloomberg
The lean yield era was characterized by low interest rates, contained inflation, and substantial monetary and fiscal stimulus. In contrast, the emerging mean yield era is expected to experience sustained inflation and a reduction in the inflated money supply that marked the lean yield period. This transition holds great significance. Despite short-term inflationary challenges, we’re confident that this shift will notably alter bond behavior over the mid to long term. The potential benefits for fixed income instruments include higher returns over time, competitive strength against other asset classes, and enhanced asset protection in turbulent times.
Higher yields typically suggest increased prospective absolute returns—a historically supported concept. As we emerged from the lean yield era in 2022, bonds faced a considerable drop. However, this self-correcting dynamic inherent in the bond market underscores its resilience. With the inverse relationship between bond prices and yields, bonds now offer an appealing value proposition, especially given present challenges. As U.S. Treasurys, core fixed income and corporate bond indexes have fallen multiple standard deviations below their decade-long valuations, we foresee improved returns once the market stabilizes.
Figure 2: Corporate Bond Yield (Green) and S&P 500 Index Current Earnings Yield (Black) Over Last 25 Years
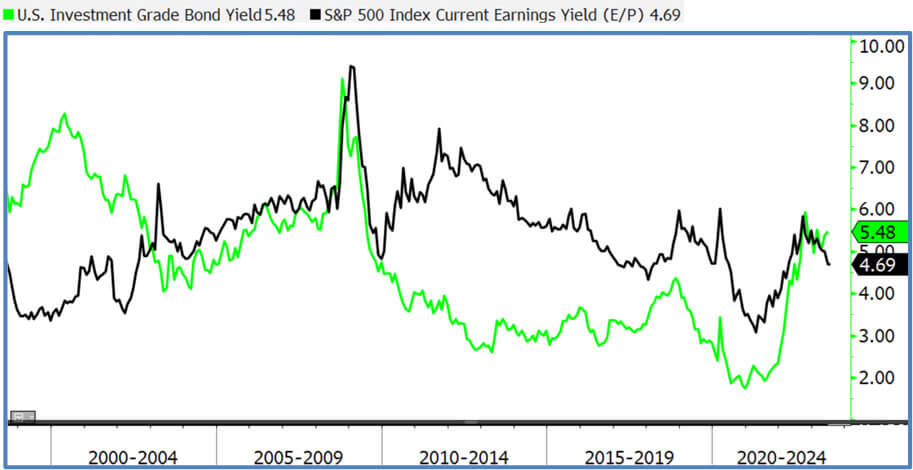
1) In Green: U.S. Investment Grade Bond Yield = Bloomberg U.S. Corporate Bond (investment grade) Index
2) In Black: S&P 500 Index Bloomberg Current Earnings Yield (calculated as the weighted average trailing 12-month EPS before extraordinary items / last price of the Index)
Source: Bloomberg
Although we believe there is a fair case to make for bonds based simply on their own merits, the prospect of higher yields also directly improves bonds’ competitiveness compared to other asset classes. In the aftermath of the global financial crisis, low bond yields prompted investors to seek equities. However, the current rise in bond yields is reshaping this trend. Safer alternatives, such as U.S. investment-grade corporate bonds, now offer yields over 5.5%, boast a history of low default rates, and provide a safety net against potential downturns. On the other hand, the S&P 500 Index offers a dividend yield of around 1.5% and an earnings yield of 4.7%. The last time we saw bonds outyielding S&P 500 earnings yields to this extent was in 2008.
This period of rising yields could also pose specific challenges for equities and potentially give bonds an edge in the coming years compared to the past decade. A recent Federal Reserve paper (Smolyansky, 2023) highlights this by arguing that over 40% of real corporate profit growth from 1989 to 2019 can be attributed to reductions in interest and corporate tax rates. In addition, Smolyansky asserts the decline in interest rates accounted for the entire expansion in P/E multiples for the S&P 500. If predictions of sustained higher interest rates and corporate tax rates materialize in the upcoming era, equities could face headwinds that make relative prospective bond returns more attractive than the previous decade.
Figure 3: Spread of Corporate Bond Yield vs. S&P 500 Earnings Yield Over Last 20 Years
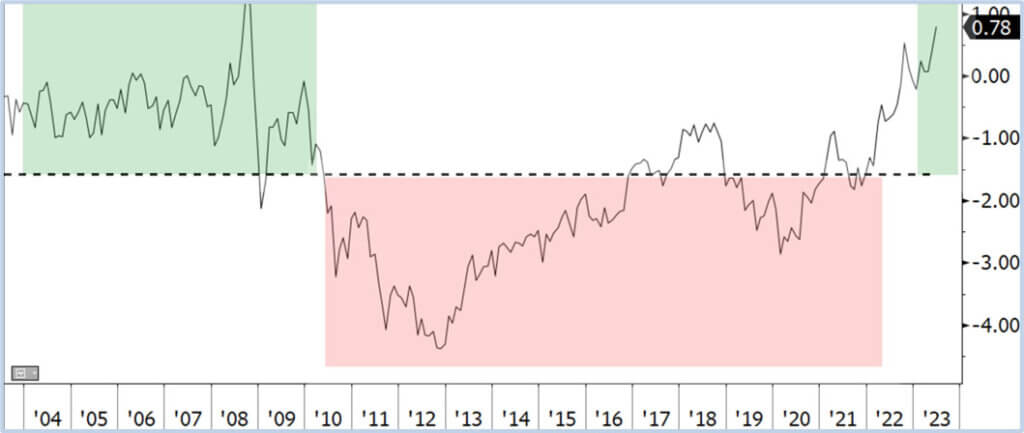
1) In black: The difference between the U.S. Investment Grade Bond Yield and the S&P 500 Index Bloomberg Current Earnings Yield (calculated as the weighted average trailing 12-month EPS before extraordinary items / last price of the Index)
Source: Bloomberg
Finally, bonds are once again becoming less correlated with equities, thereby enhancing their diversification benefits. This will be bolstered if inflation continues to slow and the Federal Reserve closes down its rate hiking cycle.
Figure 4: Correlations Between Bonds and Stocks Are Normalizing
10-Year U.S. Treasury And S&P 500 Correlation Over the Last 25 Years
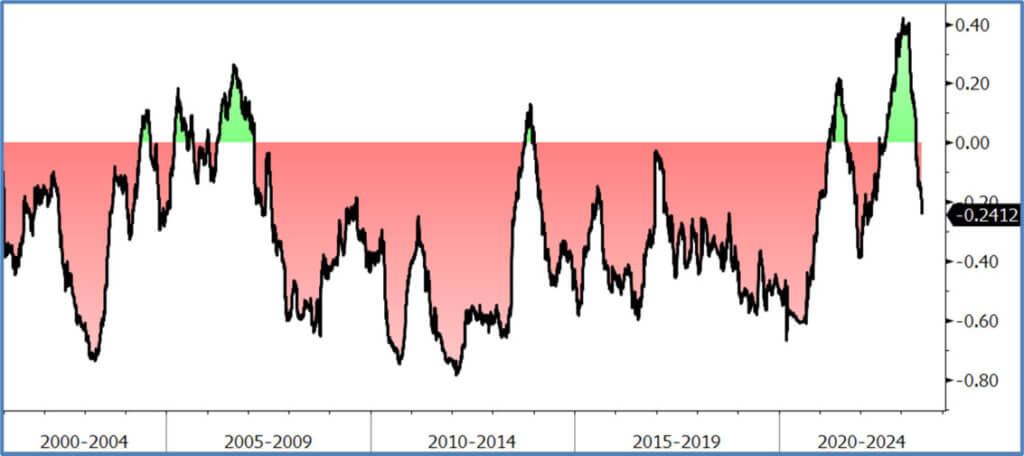
1) Bloomberg regression model: 10-Year U.S. Treasury Total Return vs. S&P 500 Index Total Return. 120-day look back, based on daily percentile moves
Source: Bloomberg
To summarize, the increase in interest rates elevates bonds as an investment class that merits consideration, particularly in light of their diminished appeal compared to other asset classes throughout the previous decade. Bonds also appear poised to reclaim their traditional role as safe havens. They now provide a compelling balance of strong absolute returns, potential relative opportunities, and stability amidst market volatility–highlighting their value in a diversified investment portfolio.
Reflecting on Our Journey
As the Fund reached its third year, we wanted to reflect on our initial goal to create a distinct offering in the fixed income space: a bond fund that encapsulates Oakmark’s values and underscores the power of active management and focused security selection. Our aim was not just to craft a fund, but to craft an investment tool that emphasized careful credit analysis, was led by responsive management, and provided investors with balanced, risk-adjusted returns.
With three years under our belt, we are pleased to share that our approach is making its mark. The Fund has consistently landed within the top decile in terms of inception to date risk-adjusted performance and in absolute returns, as per Morningstar, as of June 30, 2023. This achievement, rooted in our distinctive security selection focus, demonstrates the effectiveness of active management and underlines the value we bring to our investors’ portfolios.
Finally, for those who wish to delve further into our distinctive strategy, we are excited to announce that a comprehensive white paper will be released in the forthcoming quarter. Moreover, it is our pleasure to announce the Fund’s 5-star Morningstar rating, a recognition we were granted just as this letter was set to be published. We are indeed thrilled by this coveted 5-star rating, which we hope not only serves as a testament to our top decile risk-adjusted performance based on the trailing three year as of June 30, 2023, but also underlines our relentless commitment to providing premiere Oakmark investment options for our investors.
1Housing asset class appreciation estimated using S&P CoreLogic Case-Shiller U.S. Home Value Index from 2012 to 2022
The S&P CoreLogic Case-Shiller U.S. National Home Price NSA Index is a composite of single-family home price indices for the nine U.S. Census divisions and is calculated monthly. It is included in the S&P CoreLogic Case-Shiller Home Price Index Series which seeks to measure changes in the total value of all existing single-family housing stock.
The Morningstar RatingTM for funds, often called the star rating, is a purely quantitative, backward-looking measure of a fund’s past performance, measured from one to five stars. Star ratings are calculated at the end of every month.
The Bloomberg 10 YR US Treasury Yield Index is a one-security index comprising the most recently issued 10-year U.S. Treasury note or bond yield.
The Bloomberg Barclays U.S. Aggregate Bond Index is a broad-based benchmark that measures the investment grade, U.S. dollar-denominated, fixed-rate taxable bond market. The index includes Treasuries, government-related and corporate securities, mortgage-backed securities (agency fixed-rate and hybrid ARM pass-throughs), asset-backed securities and commercial mortgage-backed securities (agency and non-agency). This index is unmanaged and investors cannot invest directly in this index.
The Bloomberg US Corporate Bond Index measures the investment grade, fixed-rate, taxable corporate bond market. It includes USD denominated securities publicly issued by US and non-US industrial, utility and financial issuers.
The Bloomberg U.S. Corporate High Yield Bond Index measures the USD-denominated, high yield, fixed-rate corporate bond market. Securities are classified as high yield if the middle rating of Moody’s, Fitch and S&P is Ba1/BB+/BB+ or below. Bonds from issuers with an emerging markets country of risk, based on Bloomberg EM country definition, are excluded.
The S&P 500 Total Return Index is a float-adjusted, capitalization-weighted index of 500 U.S. large-capitalization stocks representing all major industries. It is a widely recognized index of broad, U.S. equity market performance. Returns reflect the reinvestment of dividends. This index is unmanaged and investors cannot invest directly in this index.
The Oakmark Bond Fund invests primarily in a diversified portfolio of bonds and other fixed-income securities. These include, but are not limited to, investment grade corporate bonds; U.S. or non-U.S.-government and government-related obligations (such as, U.S. Treasury securities); below investment-grade corporate bonds; agency mortgage backed-securities; commercial mortgage- and asset-backed securities; senior loans (such as, leveraged loans, bank loans, covenant lite loans, and/or floating rate loans); assignments; restricted securities (e.g., Rule 144A securities); and other fixed and floating rate instruments. The Fund may invest up to 20% of its assets in equity securities, such as common stocks and preferred stocks. The Fund may also hold cash or short-term debt securities from time to time and for temporary defensive purposes.
Under normal market conditions, the Fund invests at least 25% of its assets in investment-grade fixed-income securities and may invest up to 35% of its assets in below investment-grade fixed-income securities (commonly known as “high-yield” or “junk bonds”).
Fixed income risks include interest-rate and credit risk. Typically, when interest rates rise, there is a corresponding decline in bond values. Credit risk refers to the possibility that the bond issuer will not be able to make principal and interest payments.
Bond values fluctuate in price so the value of your investment can go down depending on market conditions.
The information, data, analyses, and opinions presented herein (including current investment themes, the portfolio managers’ research and investment process, and portfolio characteristics) are for informational purposes only and represent the investments and views of the portfolio managers and Harris Associates L.P. as of the date written and are subject to change and may change based on market and other conditions and without notice. This content is not a recommendation of or an offer to buy or sell a security and is not warranted to be correct, complete or accurate.
Certain comments herein are based on current expectations and are considered “forward-looking statements”. These forward looking statements reflect assumptions and analyses made by the portfolio managers and Harris Associates L.P. based on their experience and perception of historical trends, current conditions, expected future developments, and other factors they believe are relevant. Actual future results are subject to a number of investment and other risks and may prove to be different from expectations. Readers are cautioned not to place undue reliance on the forward-looking statements.
All information provided is as of 06/30/2023 unless otherwise specified.