Oakmark Equity and Income Fund – Investor Class
Average Annual Total Returns 09/30/23
Since Inception 11/01/95 9.31%
10-year 6.42%
5-year 5.86%
1-year 14.40%
3-month -1.87%
Expense Ratio: 0.83%
Expense ratios are from the Fund’s most recent prospectus dated January 28, 2023; actual expenses may vary.
Past performance is no guarantee of future results. The performance data quoted represents past performance. Current performance may be lower or higher than the performance data quoted. The investment return and principal value vary so that an investor’s shares when redeemed may be worth more or less than the original cost. To obtain the most recent month-end performance data, view it here.
The purpose of the Oakmark Equity and Income Fund (“the Fund”) is to (1) protect capital during market downturns, (2) compound capital at an attractive rate over long time horizons, and (3) deliver a competitive income stream for our shareholders. Over long time horizons, stock and bond returns are not highly correlated with one another. Bonds typically rise in price when investors anticipate economic weakness, and stocks typically outperform when anticipating economic recoveries. This dynamic helps to provide ballast during uncertain or “risk-off” market environments, protecting capital so that the Fund can increase its equity allocation at times when stocks are most undervalued. Every investment we make—no matter where it sits within the capital structure—is evaluated using the same rigorous, value-oriented framework that we’ve been successfully executing for the past 30+ years at Oakmark.
The Oakmark Equity and Income Fund has the flexibility to fluctuate its equity exposure between 40-75% depending on how fruitful the opportunity set is. There were times, such as during 2007-2008, when we believed fixed income provided a more attractive risk-reward than equities, and we reduced our equity weighting to around 50%. And there were times, like most of the decade following the global financial crisis (GFC), when we saw greater value in equities and correspondingly increased our equity weighting to 65-70%.
This ability to shift across asset classes is an advantage of our balanced strategy—and one that has been easy to overlook for the past 10-15 years. But clients should not mistake the past decade of elevated equity weightings as a sign that we have abandoned our flexible approach. Rather, we have viewed the past 10-15 years as a highly unusual period, characterized by abnormally low nominal rates, negative real rates and a dividend yield on the S&P 500 Total Return Index that often exceeded the long bond yield. All of this suggested to us that the conventional wisdom on stocks and bonds needed to be inverted: long-duration bonds with negative real yields could pose substantial portfolio risk, and undervalued equities with strong real return potential could provide ballast. As a result, we kept our allocation to fixed income low and our duration short, with duration at less than half the benchmark level. We believe the outperformance of equities over fixed income in the post-GFC era vindicated that decision.
Today, fixed income looks more attractive than it has in more than a decade. Nominal rates have risen well above the zero bound, real rates—adjusted for inflation—are in positive territory, and the yield on our fixed income portfolio is approaching the earnings yield of the S&P 500 Total Return Index. History suggests that higher yields result in increased prospective absolute returns, and we are optimistic about the outlook for our fixed income holdings. We once again see value in its ability to dampen portfolio volatility and provide ballast through a downturn. It follows that fixed income is now competing far better for real estate within our Fund. We’ve lowered our equity exposure down to around 60%, a roughly neutral state for the Fund, and we have increased our fixed income duration to 5.17. And while spreads don’t look exceptionally attractive in many pockets of the fixed income market, we continue to find idiosyncratic issues that meet our undervaluation criteria.
Oakmark Equity and Income Fund Asset Allocation:
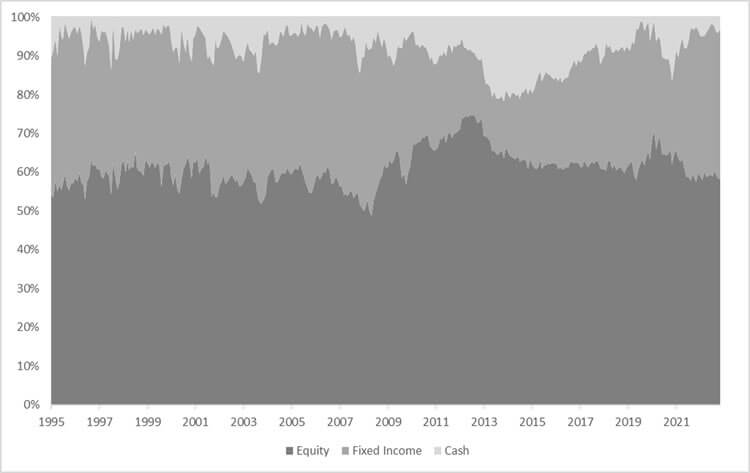
As of November 30, 1995-September 30, 2023
It is worth contrasting our flexible approach with one of the more popular balanced products of the last decade: target date funds. In the case of target date funds, investors really should interpret more consistent weightings across asset classes as a permanent lack of flexibility. Our mandate allows us to shift the portfolio based on market conditions. In contrast, target date funds are blind to varying market opportunities. This difference may not have mattered much over the past decade, but we think it will matter more over the next one.
We go where the value leads us. And just as we shift weightings depending on the opportunity set across asset classes, we shift our portfolios to take advantage of the best opportunities within asset classes. The evolution of our equity portfolio holdings over the past two years provides a nice example of this in action. We have long adhered to a broader definition of “value” than many of our peers. To us, a value investment is simply a business that trades below our estimate of its intrinsic value. This can include businesses that are cheap on traditional financial metrics (such as Capital One or Lithia Motors) as well as non-traditional value investments in which particular conditions, such as fast growth or poor accounting, masks a company’s underlying profitability (like Alphabet or Amazon).
As is the case with fixed income and equity markets, these two categories of equity investments can perform very differently over short periods of time, creating opportunities for investors with a flexible mandate. This was the case during the second half of last year when we saw unusually attractive values in some faster growing, tech-oriented businesses—our so-called non-traditional value bucket. We responded by meaningfully increasing the weightings of these holdings within our equity portfolio. This year, after the strong performance of faster growers, we’re finding greater opportunities in more traditional value sectors, like financials (both banks and non-banks) and energy. Many of our holdings in these areas are deeply out of favor and still trade for single-digit multiples of mid-cycle earnings. Our equity portfolio is once again shifting accordingly. To be clear, we aren’t making our investment decisions based on a specific top-down view of markets or sectors. Rather, we’re searching for the best risk-adjusted return opportunities in the market through a bottom-up lens and then allocating capital accordingly. You’ll find a more detailed description of our recent additions to the portfolio in the following section.
As always, we encourage our readers to establish an appropriate asset allocation between stocks and bonds based on their personal risk tolerance and objectives. Whether investors delegate the decision to us, manage their own capital or use a third party for investment advice, we believe that they should be using periods of extreme volatility to rebalance their portfolio toward the cheaper opportunity set. Doing so will allow investors to restore their portfolio to its intended asset allocation and capitalize on market dislocations.
Quarterly Review & Transaction Activity:
The Oakmark Equity and Income Fund (“the Fund”) returned -1.87% during the quarter, compared to the -2.79% return of the Lipper Balanced Fund Index. For the fiscal year, the Fund’s return is 14.40%, compared to an 11.29% return for the Lipper Index. We are proud of the fact that since the inception of the Fund in 1995, our compounded annual return of 9.31% has outperformed the Lipper Index by 273 basis points per annum.
The largest contributors to return in the quarter were Charter Communications and Alphabet, while the largest detractors were General Motors and TE Connectivity. From a sector perspective, energy and communication services contributed the most to our total return for the quarter while consumer discretionary and health care detracted the most. For the fiscal year, the Fund’s highest contributing securities were Alphabet and HCA Healthcare, while the biggest detractors were Bank of America and Sealed Air. Our investments in the consumer discretionary and communications sectors were our strongest contributors. No individual sector detracted from our total return over the fiscal year period. We continue to own each of these investments given their discounts to our estimate of business value.
We had one corporate action to report this quarter. Existing portfolio holding BorgWarner spun-off its fuel systems and aftermarket business into a new publicly traded company named Phinia. Phinia is a well-managed business that trades for just a mid-single-digit multiple of our estimate of normal earnings. We continue to hold shares in the company given that it trades well below our estimate of intrinsic value.
We initiated five new holdings and eliminated two others during the third quarter. Specifically, we sold our positions in PDC Energy (now Chevron) and Workday as each investment approached our estimate of intrinsic value. We believe our recent purchases, described below, are more attractive on a risk-adjusted return basis.
Corteva Inc.
Corteva is a leading provider of seed and crop protection chemicals. We believe the seed and crop protection markets have sizeable barriers to entry due to the duration and magnitude of investment required to compete. Both industries require constant innovation: Farmers expect seed yield improvement each year, while nature develops immunity to crop protection chemicals over time. As a result, advantages accrue to the largest players with the most R&D resources. Within this context, we believe Corteva is very well positioned. The company has scale, well-recognized brands, a loyal customer base, and a promising R&D pipeline. In addition, we see idiosyncratic opportunities for Corteva to improve its profitability over time, and we believe the current management team is executing well against this opportunity. More recently, the stock has been pressured by near-term headwinds related to inventory destocking and declining crop prices. We see this weakness as an opportunity to invest in a high-quality and defensible business at a discount to both its own historical trading multiple and private market transactions.
Centene Corporation
Centene is one of the largest health insurers in the U.S. The company specializes in three major government-sponsored programs: Medicaid, Marketplace and Medicare Advantage. Each of these benefits from long-term secular tailwinds. In Medicaid, states are steadily outsourcing their programs to managed care companies, like Centene, as it helps states reduce costs and improve care quality. Indeed, Managed Medicaid penetration has increased from 25% of total Medicaid spend in 2010 to 60% today, and we expect further gains over time. In Marketplace, growth is driven by the trend toward more individuals buying health insurance. Centene holds the #1 market share in both of these programs and is well positioned to capitalize on their continued growth. The stock trades for 10x consensus 2024 EPS, but this doesn’t tell the whole story. Past missteps in Centene’s Medicare business will result in that segment losing $0.80 per share next year. We believe Centene can turn Medicare around and generate positive earnings in the next few years. This could increase EPS by more than $1 per share and reduce the P/E ratio to just 8.5x. We think that’s too cheap for a business that generates healthy returns on capital and is capable of growing EPS at a low double-digit rate.
Kroger Co.
Kroger is the second-largest grocery retailer in America behind only Walmart. Although the grocery industry is highly competitive, Kroger’s scale advantages allow it to offer a more compelling value proposition than smaller peers and earn higher returns on capital. In recent years, the market has assigned Kroger a lower multiple due to concerns that e-commerce would disrupt traditional brick-and-mortar grocery. However, we believe the company’s performance through the pandemic highlighted that its store footprint, distribution infrastructure, technology investments and strong brand all position the company well for a world with higher online grocery adoption. The stock trades for just 10x our estimate of next year’s EPS, which we believe is attractive given Kroger’s competitive positioning and earnings growth outlook. The pending merger with Albertsons has the potential to drive accelerated earnings growth and further scale advantages. If the merger is not approved, the company will have the capacity to return approximately 25% of its market cap to shareholders.
Brunswick Corporation
Brunswick is the leading manufacturer of marine engines, boats, and related parts and accessories. The company is commonly viewed as a cyclical boat manufacturer, but the business has evolved in recent years such that most of its profits now come from its outboard engine and aftermarket segments. These are high-quality businesses in which Brunswick has material competitive advantages and generates high returns on invested capital. The Mercury outboard business is the crown jewel. Over the past decade, Mercury has taken advantage of its leading scale to fund large investments in R&D and product development. These investments have driven consistent market share gains and enabled Mercury to carve out a dominant position in the fast-growing, high-horsepower part of the outboard market. Meanwhile, Brunswick has grown its parts and accessories business through attractive acquisitions that benefit from its broad-based distribution. The combination has shifted the business mix toward more resilient and faster growing profit streams that we believe are underappreciated today. The combination of recession fears and a stale business perception provided us with an opportunity to buy this high-quality franchise at a single-digit multiple of our estimate of mid-cycle earnings power. In our view, this is an attractive price for such a strong franchise.
Interpublic Group
Interpublic Group (IPG) is one of the largest advertising holding companies in the world. It has led the industry in both organic revenue growth and operating margin expansion for several years. We believe that this outperformance has been driven by the company’s collaborative approach across agency teams, focus on maintaining leading creative capabilities, and more transparent media buying relative to competitors. In addition, we think that IPG’s “build rather than buy” approach to digital and expertise in data management (further enhanced by its acquisition of Acxiom), has further differentiated the company. Although revenue growth has slowed recently due to reduced spending by tech and telecom clients and related softness at certain specialist agencies, we expect IPG to return to faster growth later this year and into 2024. At only 10x our estimate of normal earnings, the company trades well below our estimate of intrinsic value.
We take into consideration the tax efficiency of the Fund to help maximize after-tax returns. As a result, we do not anticipate paying a capital gains distribution this year.
As always, we thank our fellow shareholders for investing with us in the Oakmark Equity and Income Fund.
The securities mentioned above comprise the following preliminary percentages of the Oakmark Equity and Income Fund’s total net assets as of 09/30/23: Albertsons 0%, Alphabet Cl A 3.3%, Amazon 1.6%, Bank of America 2.5%, BorgWarner 1.5%, Brunswick 0.5%, Capital One Financial 1.6%, Carlisle 1.6%, Centene 1.1%, Charter Communications Cl A 2.6%, Corteva 1.0%, General Motors 1.2%, HCA Healthcare 0.5%, Interpublic Group 0.9%, Kroger 1.3%, Lithia Motors Cl A 1.3%, PDC Energy 0%, PHINIA 0.2%, TE Connectivity 1.6%, Walmart 0% and Workday 0%. Portfolio holdings are subject to change without notice and are not intended as recommendations of individual stocks.
The information, data, analyses, and opinions presented herein (including current investment themes, the portfolio managers’ research and investment process, and portfolio characteristics) are for informational purposes only and represent the investments and views of the portfolio managers and Harris Associates L.P. as of the date written and are subject to change and may change based on market and other conditions and without notice. This content is not a recommendation of or an offer to buy or sell a security and is not warranted to be correct, complete or accurate.
Certain comments herein are based on current expectations and are considered “forward-looking statements”. These forward looking statements reflect assumptions and analyses made by the portfolio managers and Harris Associates L.P. based on their experience and perception of historical trends, current conditions, expected future developments, and other factors they believe are relevant. Actual future results are subject to a number of investment and other risks and may prove to be different from expectations. Readers are cautioned not to place undue reliance on the forward-looking statements.
Harris Associates L.P. does not provide tax or legal advice. Please consult with a tax or legal professional prior to making any investment decisions.
EPS refers to Earnings Per Share and is calculated by dividing total earnings by the number of shares outstanding.
The price to earnings ratio (“P/E”) compares a company’s current share price to its per-share earnings. It may also be known as the “price multiple” or “earnings multiple”, and gives a general indication of how expensive or cheap a stock is. Investors should not base investment decisions on any single attribute or characteristic data point.
The S&P 500 Total Return Index is a float-adjusted, capitalization-weighted index of 500 U.S. large-capitalization stocks representing all major industries. It is a widely recognized index of broad, U.S. equity market performance. Returns reflect the reinvestment of dividends. This index is unmanaged and investors cannot invest directly in this index.
The Lipper Balanced Fund Index measures the equal-weighted performance of the 30 largest U.S. balanced funds as defined by Lipper. This index is unmanaged and investors cannot invest directly in this index.
The Fund invests in medium- and lower-quality debt securities that have higher yield potential but present greater investment and credit risk than higher-quality securities, which may result in greater share price volatility. An economic downturn could severely disrupt the market in medium or lower grade debt securities and adversely affect the value of outstanding bonds and the ability of the issuers to repay principal and interest.
The Oakmark Equity and Income Fund’s portfolio tends to be invested in a relatively small number of stocks. As a result, the appreciation or depreciation of any one security held by the Fund will have a greater impact on the Fund’s net asset value than it would if the Fund invested in a larger number of securities. Although that strategy has the potential to generate attractive returns over time, it also increases the Fund’s volatility.
All information provided is as of 09/30/2023 unless otherwise specified.