Are large-cap stocks really less risky?
The large-cap universe, which refers to the 250 stocks with the highest market capitalizations, is getting smaller. There were 40 newcomers to the large-cap universe in just the past year and they are much smaller businesses than those that exited. The median level of sales for these new additions was just under $2.4 billion. Compare that to the companies that exited the large-cap universe: only two of them had sales below $2.4 billion and their median sales was nearly $14 billion. The reason those new additions are now considered large cap is because the market is valuing them highly relative to their sales. The median new large-cap stock is selling at nearly 13 times its trailing sales. The companies no longer considered large cap are selling at just 1.4 times sales. Big businesses, such as Schlumberger, Phillips 66, Southwest Airlines and Dollar Tree, no longer qualify as large cap having been displaced by the likes of Square, Splunk and Snap.
Why is this important? Investors typically view large-cap stocks as less risky than small-cap stocks—and we would normally agree. Large companies usually have longer histories, more consistent profit margins and predictable competitive dynamics. As an example, it is easier to forecast the market shares a decade from now for the large insurers than for emerging online gaming companies. It is less difficult to guess the future profit margin for a large food company than it is for a new payments company that has just turned profitable. One problem with thinking that large-cap stocks are less risky is if that classification is due to a large valuation multiple rather than a large underlying business. In that case, the investor faces magnified risk: the higher risk inherent in a small business combined with the extra risk associated with a high valuation multiple.
At Oakmark, we are long-term investors. We attempt to identify growing businesses that are managed to benefit their shareholders. We will purchase stock in those businesses only when priced substantially below our estimate of intrinsic value. After purchase, we patiently wait for the gap between stock price and intrinsic value to close.
The biggest newcomer to the large-cap list this year was Zoom Video Communications. The company has a market cap of $134 billion and sells at nearly 100 times trailing sales. With so many people working from home, video conferencing has been a lifesaver. Most days I have multiple video calls. When people talk about changes from the past six months that are likely to outlast Covid-19, increased use of video conferencing is at the top of most lists. I use Zoom frequently and love the service. But I also use Cisco Webex, Microsoft Teams, Google Meet, Apple FaceTime and Verizon BlueJeans Meetings. When I’m on a call, it’s hard to remember which one I’m using because the services are so similar. Zoom’s competitors are not underfunded startups, but rather are some of the biggest businesses in the world. While it is easy to project that video conferencing will grow over the next decade, there is a wide range in the growth estimates, and it is hard to predict what market shares will be, what the services will cost or what profit margins will look like. Zoom faces the uncertainties you’d expect for a young company with $1 billion of sales. But its future is much more uncertain than you’d typically see from a $134 billion market-cap stock. Will Zoom stock perform well from here? I have no idea. But I do know the range of possible outcomes for the business is much wider than it is for most companies that enjoy a market cap above $100 billion.
One of our many financial holdings, Wells Fargo, has a market cap just under $100 billion, less than three-quarters of Zoom’s cap. But Wells is one of the big three retail banks in the U.S. along with Bank of America (also a current portfolio holding) and JPMorgan. The demand for retail banking has been relatively predictable and has grown with GDP. Ten years ago, the same three banks were the largest. Due to economies of scale, their market share has grown over the past decade. It doesn’t take much imagination to assume that 10 years from now, the banking industry will be larger than it is today and that these three competitively advantaged banks should have more market share. Banks have historically earned a low-to-mid teens return on their tangible equity, and we expect that to continue. The relatively narrow range of outcomes for any of the large banks stands in stark contrast to the very wide range for a small business like Zoom.
With many of the banks, including Wells and Bank of America, priced at single digit P/E ratios, we believe reversion to the mean is on our side. Financial stocks, including banks, have typically sold at about two-thirds of the S&P 500 multiple. They are currently trading at seven to eight times pre-Covid-19 earnings. And if they have accurately estimated their Covid-19-related charge-offs, they should quickly return to those earnings. We believe they deserve P/E ratios at least 50% higher than their trailing P/E ratios, which would be consistent with their long-term average. And when (or if) interest rates eventually rise, they are expected to produce a further increase in earnings. Compared to the small businesses that are now large-cap stocks, we believe the banks are both less risky and have larger expected returns.
In the Oakmark Fund, we buy large businesses because we view them as less risky than small businesses. Rather than defining “large” based on market capitalization, we define it by business fundamentals: sales, net income or shareholders’ equity (book value). If a company is in the 250 largest on any of those metrics, we consider it “large” and in our investible universe, regardless of its market capitalization. Typically, there isn’t too much difference between the universe of large businesses and large-cap stocks. But at times when investors will seemingly pay any price for growth, small businesses with very high valuations begin crowding out big businesses from the large-cap universe.
Empirical Research tracks the price investors have been willing to pay for high growth. This chart compares the P/E multiples for fast growers to the lowest P/E companies.
Ratio of the Big Growers and Cheapest Large Capitalization Stocks Relative Trailing-P/E Ratios¹
1952 Through Late-July 2020
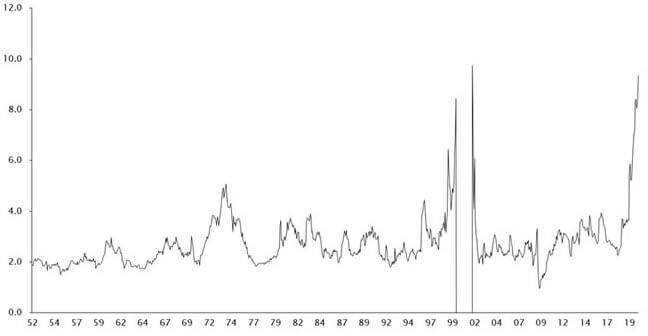
Source: Empirical Research Partners Analysis.
¹ Equally-weighted data; excludes negative earnings during the New Economy era.
It uses a proprietary list of 75 fast growers (combining sales growth and earnings growth over varying time periods to weed out cyclical companies recovering from a downturn) and compares their P/E to the 100 lowest P/E companies in a universe that mimics the Russell 1000 Value Index. As you can see, for nearly 70 years, with the exception of the spike during the internet bubble in 1999, the P/E on the highest growers has typically been two to three times the P/E for the cheapest stocks. In 1999, when value investing was as out of favor as it is today, investors were paying nine times as much for rapid growers as for low multiple stocks. That premium was three to four times larger than normal.
Today, like 20 years ago, the fast growers have P/E ratios nearly 10 times higher than the lowest multiple stocks. Although low interest rates and shortcomings of GAAP accounting could justify a somewhat higher multiple than the 2-3x frequently observed over the past 70 years, 10 times strikes us as extreme. That large valuation spread is causing a divergence between large businesses and large-cap stocks. Of the 40 stocks that fell out of the large-cap universe over the past year, 35 qualified as large businesses based on sales, income or book value. Of the 40 that replaced them, only 9 did. This roughly doubled the number of “small business large-cap” stocks compared to a year ago. In the Oakmark Select Fund, three holdings that were considered large cap a year ago—AIG International, EOG Resources and Hilton Worldwide—are now considered mid-cap stocks. In the Oakmark Fund, we bought 10 new stocks over the past year. Despite us considering them large businesses, only five were classified as large cap at the time of purchase.
We faced a similar situation 20 years ago when the dot-com bubble peaked, and we wrote about it in the Oakmark Fund September 2000 report:
Oakmark—A Large Company Fund
- When investors categorize equity mutual funds, they generally look at two criteria: investment style and the size of the companies being purchased. For investment style—growth or value—The Oakmark Fund is clearly a value fund. All our energy goes into identifying and buying inexpensive stocks, selling them when they are no longer inexpensive, and then repeating the process. To categorize us based on the size of companies we purchase is more difficult. Since larger companies tend to have longer operating histories and more predictable earnings streams, they tend to be less risky investments. Therefore, many investors prefer mutual funds that focus on larger companies, as we do in The Oakmark Fund.
- We believe The Oakmark Fund has always invested primarily in large companies. That’s because when we think of large, we think of fundamental characteristics that measure the size of underlying businesses. Using measures like sales, net income or shareholders’ equity, most of our investments have been and still are in stocks that are among the 250 largest businesses in the United States. But most organizations that categorize mutual funds look instead at how Wall Street values those businesses. For example, Morningstar calls the 250 stocks with the biggest market capitalizations “large cap.” Based on their definition, a “large cap fund” primarily buys stocks that have market capitalizations over $10 billion. Because we own many stocks with market caps below $10 billion, in the last quarter Morningstar moved The Oakmark Fund from the “large cap value” to the “mid cap value” category.
- This is important because we believe that investors who own funds that are still called “large cap” may not be getting the lower risk level they expect from investing in large companies. Last year, many small companies, mostly technology companies, had such high stock prices that they were categorized as large-cap stocks. By our count, the number of these small-company large-caps was five times as high as it was a decade ago! These stocks have a much higher risk profile than is typically associated with large companies. Avoiding these stocks is what has reduced the average market capitalization of our stock positions. The Oakmark Fund will continue buying stocks in large companies that we believe are priced at bargain levels. We believe this is simply acting rationally in a market that has priced many securities irrationally. And, if that means that, in this environment, our “large company value” fund gets categorized as “mid cap value,” it just shows we are doing our job!
We believe those words of caution, which proved timely 20 years ago, are again applicable. If the price for growth remains this high or goes higher, we expect that more of our holdings will get classified as mid cap. Today, 250 companies have market caps above $26 billion, and to meet Morningstar’s definition of large cap, companies now need a market cap of about $35 billion. (Morningstar now ranks companies by cap and sets the large-cap line at 70% of total public market cap.) Most of the large businesses our analysts are working on today have market caps below $35 billion. This means more of our new positions are likely to be mid cap than usual. Though our funds may look less large cap, it will be because we are doing the same thing we did in 2000 and have done for all the years since—buying big businesses that appear undervalued.
The securities mentioned above comprise the following percentages of the Oakmark Fund’s total net assets as of 09/30/20: American Intl Group 1.9%, Apple 0%, Bank of America 3.0%, Cisco 0%, Dollar Tree 0%, EOG Resources 0.9%, Alphabet Cl A 3.8%, Hilton Worldwide 1.9%, JPMorgan 0%, Microsoft 0%, Phillips 66 0%, Schlumberger 0%, Snap 0%, Southwest Airlines 0%, Splunk 0%, Square 0%, Verizon 0%, Wells Fargo 1.4% and Zoom Video Communications 0%. Portfolio holdings are subject to change without notice and are not intended as recommendations of individual stocks.
View the full list of Oakmark Fund holdings as of the most recent quarter-end.
The securities mentioned above comprise the following percentages of the Oakmark Select Fund’s total net assets as of 09/30/20: Schlumberger 0%, American Intl Group 3.7%, Apple 0%, Bank of America 4.7%, Cisco 0%, Dollar Tree 0%, EOG Resources 2.2%, Alphabet Cl A 10.3%, Hilton Worldwide 2.8%, JPMorgan 0%, Microsoft 0%, Phillips 66 0%, Snap 0%, Southwest Airlines 0%, Splunk 0%, Square 0%, Verizon 0%, Wells Fargo 0% and Zoom Video Communications 0%. Portfolio holdings are subject to change without notice and are not intended as recommendations of individual stocks.
View the full list of Oakmark Select Fund holdings as of the most recent quarter-end.
The S&P 500 Total Return Index is a float-adjusted, capitalization-weighted index of 500 U.S. large-capitalization stocks representing all major industries. It is a widely recognized index of broad, U.S. equity market performance. Returns reflect the reinvestment of dividends. This index is unmanaged and investors cannot invest directly in this index.
The Russell 1000® Value Index measures the performance of the large-cap value segment of the U.S. equity universe. It includes those Russell 1000® companies with lower price-to-book ratios and lower expected growth values. This index is unmanaged and investors cannot invest directly in this index.
The price to earnings ratio (“P/E”) compares a company’s current share price to its per-share earnings. It may also be known as the “price multiple” or “earnings multiple”, and gives a general indication of how expensive or cheap a stock is. Investors should not base investment decisions on any single attribute or characteristic data point.
Trailing price-to-earnings (P/E) is a relative valuation multiple that is based on the last 12 months of actual earnings. It is calculated by taking the current stock price and dividing it by the trailing earnings per share (EPS) for the past 12 months.
GAAP stands for generally accepted accounting principles.
The Oakmark Funds’ portfolios tend to be invested in a relatively small number of stocks. As a result, the appreciation or depreciation of any one security held by the Fund will have a greater impact on the Fund’s net asset value than it would if the Fund invested in a larger number of securities. Although that strategy has the potential to generate attractive returns over time, it also increases the Fund’s volatility.
Because the Oakmark Select Fund is non-diversified, the performance of each holding will have a greater impact on the Fund’s total return, and may make the Fund’s returns more volatile than a more diversified fund.
Oakmark Select Fund: The stocks of medium-sized companies tend to be more volatile than those of large companies and have underperformed the stocks of small and large companies during some periods.
The information, data, analyses, and opinions presented herein (including current investment themes, the portfolio managers’ research and investment process, and portfolio characteristics) are for informational purposes only and represent the investments and views of the portfolio managers and Harris Associates L.P. as of the date written and are subject to change and may change based on market and other conditions and without notice. This content is not a recommendation of or an offer to buy or sell a security and is not warranted to be correct, complete or accurate.
Certain comments herein are based on current expectations and are considered “forward-looking statements”. These forward looking statements reflect assumptions and analyses made by the portfolio managers and Harris Associates L.P. based on their experience and perception of historical trends, current conditions, expected future developments, and other factors they believe are relevant. Actual future results are subject to a number of investment and other risks and may prove to be different from expectations. Readers are cautioned not to place undue reliance on the forward-looking statements.
All information provided is as of 09/30/2020 unless otherwise specified.