“People who exit the stock market to avoid a decline are odds-on favorites to miss the next rally.” –Peter Lynch, Fidelity Magellan Fund manager (1977-1990)
At Oakmark, we are long-term investors. We attempt to identify growing businesses that are managed to benefit their shareholders. We will purchase stock in those businesses only when priced substantially below our estimate of intrinsic value. After purchase, we patiently wait for the gap between stock price and intrinsic value to close.
Last week I received an email from a shareholder who retired a decade ago. She said that the market decline was really getting to her and that for the first time since she retired, she’s worried about running out of money. As I started to write my “stay the course” response, I thought this is the very issue most of our shareholders are facing today.
Why are so many people now worried that they could run out of money? The S&P 500 is down 24% this year. Bonds are faring even worse, with the U.S. Treasury 20-year bond losing 30% year to date. That means asset allocation between stocks and bonds didn’t matter much this year. A portfolio for a retiree—often something like 60% stocks and 40% bonds—could have lost even more than an all-equity portfolio, depending on the bonds’ maturities. Further, assuming they were using that portfolio to meet living expenses, its value could easily be down 30%. Finally, factor in 8% inflation, the highest in over 40 years, and many portfolios have lost over 35% of their purchasing power. No wonder logical people are wondering how much more of this they can take.
So, what now?
Asset Allocation
This past year has been highly unusual with long bonds losing more of their value than stocks have. In the past 30 years, there have been six years when the S&P 500 was down, with the average loss being 15%. The average return of the Bloomberg 20-year+ Government Bond Index during those six years was plus 13%, including the only year it was negative, losing 2%. It is an understatement to call 2022 an outlier. Normally, bonds are less volatile than stocks and further, the two are not highly correlated with one another. For example, when investors worry about an economic slowdown, bonds typically rise in price while equities fall and vice versa when anticipating economic recoveries. So, holding bonds along with equities usually results in a less volatile portfolio.
What was different this year? Interest rates started the year at close to zero. Throughout most of history, long government bonds have yielded slightly more than inflation. Because interest rates were well below that for some time, we frequently wrote that we believed long bonds were overvalued and didn’t think they would reduce risk in balanced portfolios. But for several years before 2022, portfolios invested in both very long duration bonds and very high P/E stocks (effectively very long duration, too) performed as if they were very low risk. The bonds usually went down in value when investors embraced the risk of equities and went up when investors wanted to sell risk, cushioning the loss in stocks. But this year, all long-duration assets went down as interest rates were raised to try and tame inflation. And the longest duration stocks and bonds went down the most. This shows the danger of basing risk assessment solely on recent prices rather than using a more complete analysis of fundamental risks.
With the yields on long bonds now above long-term inflation estimates, consistent with their history, we believe bonds can again perform their risk-reducing role in a diversified portfolio. We encourage investors to establish an appropriate asset allocation between stocks and bonds and use periods of extreme volatility as opportunities to sell the stronger performing asset and reinvest in the weaker asset, restoring the intended asset allocation.
What is an appropriate asset allocation? There isn’t one perfect asset class for a retiree. Cash usually earns very low returns, bonds provide no protection against inflation and equities can be too volatile for a portfolio being used to meet living expenses. That’s why most advisors recommend a mix. The younger you are, the longer your investment horizon, and the more appropriate equities are for most of your portfolio. The rule of thumb when I started in this business was that a reasonable equity percentage was to subtract your age from 100. So, a 70-year-old would target 30% stocks and 70% bonds. But because life expectancies have increased so much, most financial advisors would say that formula has become too conservative and would use something like 120 less your age, meaning a 70-year-old could be 50% invested in equities. Precision isn’t necessarily the goal. Think more of getting in the right ballpark and then opportunistically rebalancing to stay there.
Bear Market
I wrote last quarter that there have been 11 times in the past 77 years when the stock market fell by over 20%. The median decline after falling 20% was another 10%, and the ultimate bottom occurred a median of 117 days later. How is this decline stacking up? We hit down 20% on June 13. We’ve lost another 7% in the 109 days since then. So, we are within both a couple of days and a couple of percent loss of a “normal” bear market. Of course, it could get worse, and it did in half the previous bear markets. But I think it should be somewhat comforting to know that we’ve already experienced the typical bear market.
In last quarter’s commentary, I also showed that the market tended to increase more than usual following a bear market. The average two-year increase was 33% after hitting down 20%, meaning the market had usually recovered more than all its losses within two years. Further, that 33% gain was nearly double the median two-year increase. This positive outlook can be hard to wrap your arms around given that most advice you hear, especially from professionals, is to get more cautious after the market has fallen.
The tendency of good periods following bad and vice versa is part of the reason why the long-term risk-return characteristics of equities have been so favorable. The table below shows the average 1-, 5-, 10- and 20-year total returns for the S&P 500 for the past 77 years and the best and worst returns for each period.
| Time | Average Return | High Return | Low Return | Annualized Std Deviation |
|---|---|---|---|---|
| 1 yr | 12% | 61% | -39% | 17% |
| 5 yr | 80% | 251% | -22% | 7% |
| 10 yr | 215% | 587% | -26% | 5% |
| 20 yr | 784% | 2753% | +155% | 3% |
There are two things I’d like to direct your attention to. First, the power of compounding. A 12% return in one year isn’t life changing, but stay invested for 20 years and, on average, you’ve grown your capital nearly ninefold. Second, notice that the lowest number on the chart is the worst one-year return, a 39% loss. As the time extends, not only do the average results improve, but the worst losses also get smaller. In fact, the worst 20-year result has been a gain of 155%. The fact that risk decreases with time is also apparent in the annualized standard deviations, which are lowest for the longest holding periods. That means the annual returns are not independent of each other, but rather, are mean reverting. And that’s good to know after a year like this year.
That’s why we encourage buying stocks only for investors who can leave their money in the market for multiple years. If you expect to cash in your stocks in just a year, you expose yourself to a loss that is multiples of your expected gain. If you can wait five years to cash in, your expected gain is multiples of the worst historical loss. And if you can wait 20 years, there has never been an outcome worse than doubling your investment. We say you shouldn’t buy stocks if you expect to sell within five years. And we also discourage market timing. Most investors tend to throw in the towel after large losses and go all in after large gains. History says the opposite has produced better results.
“A Stock Pickers’ Market”
This is another meaningless phrase that permeates the financial media. It is mostly used when the market is high, and the speaker is trying to say that their favorite stocks will be spared when the market eventually declines. Though we don’t use that term, we’ve also been guilty of incorrectly thinking our favorite stocks could withstand a market decline.
What would define a good opportunity for picking stocks? If success means selecting stocks that increase more than the average stock, then a target-rich environment would be when there is a wide range in how stocks are being priced, meaning more stocks than usual are selling at extremely high and extremely low valuations. The narrower the distribution, the harder it is to differentiate returns via stock selection. One way to measure the opportunity is to look at the distribution of P/E ratios. (Price-to-intrinsic value would be more precise, but that is a hard metric to compute and nearly impossible to reconstruct historically.)
How does today’s P/E distribution compare to history? We looked at the distribution of trailing P/E ratios for the S&P 500 and compared the 450th highest P/E to the 50th highest. Over the past 30 years, the 50th highest P/E has averaged 47 while the 450th highest averaged 11. So in about half of the years the highest P/Es were more than four times as large as the lowest, and were less than four times in the other half of the years.
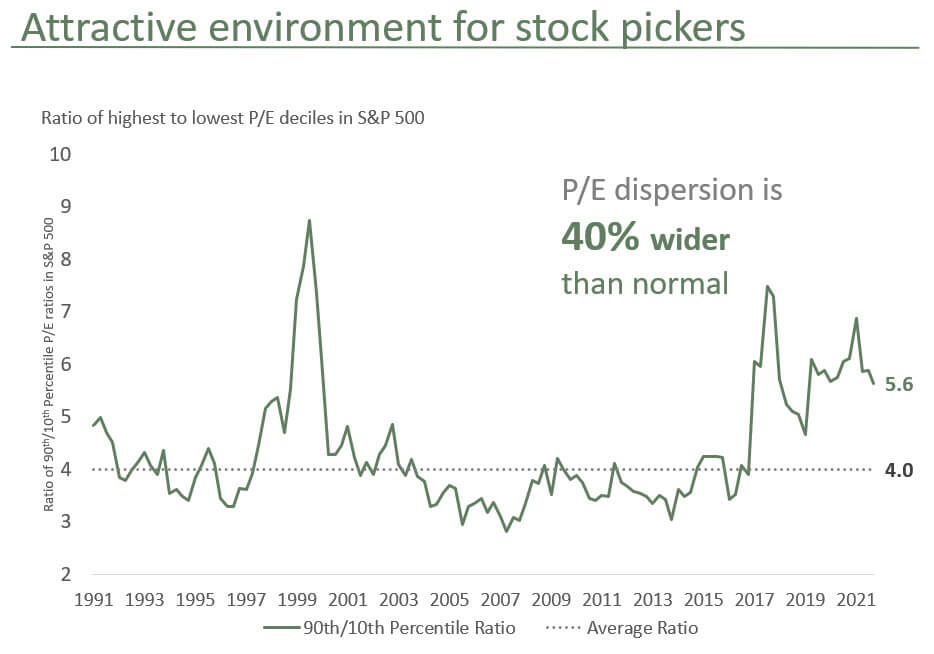
Today the 50th highest P/E is above normal at 50 times, and the 50th lowest is below normal, under nine times, for a ratio of 5.6. So, the P/E dispersion is about 40% wider than normal. As has often been the case, unusually high volatility leads to a high spread in valuations, which has been—and we believe will be—a good environment to add value via stock picking. I’ve said the same thing in previous quarterlies when the ratio was even higher, but because of a couple of poor-performing stocks, we haven’t added the value we expected to as this ratio began to decline. Despite that, we still believe that today presents a better than average opportunity set. We expect not only good performance from the market, but better performance for the stocks we identify as attractively priced.
Our Advice
A lot of capital has been erased in 2022 as both stocks and bonds experienced bear markets, and the purchasing power of portfolios has been eroded by high inflation. We estimate that, just in the United States, so far in 2022 stocks have lost $14 trillion of value, bonds lost another $8 trillion and inflation has taken another $6 trillion. The combined reduction in purchasing power of $28 trillion is truly worthy of using the word “unprecedented.” I hope the Fed considers that number as it attempts to balance slowing inflation and slowing the economy.
To the retiree who wrote to me: you are right to be concerned about your portfolio losses, but how you deal with that concern will influence how permanent your loss becomes. Our advice is pretty old-fashioned:
- If you wake up at night thinking about your investment portfolio, you should reduce your risk.
- Defer discretionary spending until markets have recovered.
- Don’t listen to media pundits’ advice on market timing.
- Asset allocation matters, and investing in both stocks and bonds helps control risk.
- Market volatility creates an opportunity to rebalance to your target asset allocation.
- When valuation spreads are above normal, look to add value by stock picking.
- Investors hurt themselves by selling after declines and buying after increases. Do the opposite.
We’ve already experienced the duration and magnitude of the average bear market. Obviously, that’s no guarantee it won’t continue. But remember that equities have historically been the best-performing asset class despite the occasional painful bear market. We see no reason that should change.
The S&P 500 Total Return Index is a float-adjusted, capitalization-weighted index of 500 U.S. large-capitalization stocks representing all major industries. It is a widely recognized index of broad, U.S. equity market performance. Returns reflect the reinvestment of dividends. This index is unmanaged and investors cannot invest directly in this index.
The Bloomberg US Treasury: 20+ Year Index measures US dollar-denominated, fixed-rate, nominal debt issued by the US Treasury with 20+ years to maturity. This index is unmanaged and investors cannot invest directly in this index.
The price to earnings ratio (“P/E”) compares a company’s current share price to its per-share earnings. It may also be known as the “price multiple” or “earnings multiple”, and gives a general indication of how expensive or cheap a stock is. Investors should not base investment decisions on any single attribute or characteristic data point.
The Oakmark Funds’ portfolios tend to be invested in a relatively small number of stocks. As a result, the appreciation or depreciation of any one security held by the Fund will have a greater impact on the Fund’s net asset value than it would if the Fund invested in a larger number of securities. Although that strategy has the potential to generate attractive returns over time, it also increases the Fund’s volatility.
Because the Oakmark Select Fund and Oakmark Global Select Fund are non-diversified, the performance of each holding will have a greater impact on the fund’s total return, and may make the fund’s returns more volatile than a more diversified fund.
The stocks of medium-sized companies tend to be more volatile than those of large companies and have underperformed the stocks of small and large companies during some periods.
The information, data, analyses, and opinions presented herein (including current investment themes, the portfolio managers’ research and investment process, and portfolio characteristics) are for informational purposes only and represent the investments and views of the portfolio managers and Harris Associates L.P. as of the date written and are subject to change and may change based on market and other conditions and without notice. This content is not a recommendation of or an offer to buy or sell a security and is not warranted to be correct, complete or accurate.
Certain comments herein are based on current expectations and are considered “forward-looking statements”. These forward looking statements reflect assumptions and analyses made by the portfolio managers and Harris Associates L.P. based on their experience and perception of historical trends, current conditions, expected future developments, and other factors they believe are relevant. Actual future results are subject to a number of investment and other risks and may prove to be different from expectations. Readers are cautioned not to place undue reliance on the forward-looking statements.
All information provided is as of 09/30/2022 unless otherwise specified.