Last quarter, I wrote about the disconnect between the performance of the businesses we own and their stock prices. In general, the businesses performed about as we expected, but the stocks performed poorly. Though stock price and business performance will eventually converge, there is no such assurance in the short run. This past quarter was, frustratingly, consistent with the past year, as our stocks continued to underperform our businesses. Given the disappointing portfolio returns that we and others produced, we encourage you to reevaluate your holdings and make sure your managers are still investing like you expected them to when you purchased the funds. To that end, let’s look at how your money is invested today in Oakmark. (The Oakmark Select quarterly letter will detail the current composition of that portfolio.)
I’ll go straight to the conclusion: The stock market looks more attractive to us than it usually does, and the divergence among individual stocks allowed us to structure a portfolio that we believe is more undervalued relative to the market than it usually is. Though the decline has made watching the market painful, we are all gritting our teeth and adding to our personal holdings.
The decline in stock prices in 2018, combined with higher corporate earnings, has reduced the multiple on 2019 consensus S&P estimates to less than 14 times. (Our definition of earnings is operating earnings with goodwill amortization added back.) That multiple is about 15% below its historical average. We see no reason to think bond yields have become high enough to warrant this lower P/E. The 10-year Treasury yield is less than 3% today, despite averaging 6% over the past 40 years when stocks averaged a higher P/E. Stocks have historically been the best performing asset category, and from this starting point, we would expect stocks to outperform bonds by more than they usually have.
Moving to our portfolio, let’s start with an opportunity that cuts across different sectors—companies that we believe are undervalued despite GAAP (Generally Accepted Accounting Principles) metrics that make them look expensive. Oakmark has usually held some of these investments, going back to the 1990s when we owned cable and biotechnology companies. About 15% of our portfolio is currently invested in these names—Alphabet, Regeneron, Netflix, Gartner, MGM, News Corp and Facebook. In each case, we believe that either expenses as defined by GAAP are penalizing current earnings more than is economically appropriate or that assets with substantial long-term value are not producing significant income. Our willingness to invest in these companies has been—and we believe will continue to be—a positive differentiator for Oakmark. However, it is important to recognize that we also expect our performance to be largely determined by the 85% of the portfolio that is invested in more traditional value stocks.
Almost twice as much of the portfolio, about 25% of it, is invested in financial companies. Most of our financials are banks, the largest positions are Citigroup, Bank of America, Capital One Financial, Ally Financial and State Street. These stocks sell for seven and eight times 2019 consensus estimates, average a 3% dividend yield and are repurchasing a lot of their own stock. Investors appear worried that banks will act as poorly in the next recession as they did in the last one. In addition to stating the obvious—that 2008 was much worse than a typical recession—we would add that big banks have lowered their financial leverage, tightened lending standards and used technology to increase their competitive advantage versus smaller banks. They are selling at a larger than normal discount to the market P/E multiple, despite our belief that they have become better businesses.
About one-quarter of the portfolio is also invested in cyclical businesses: industrial, consumer discretionary and energy companies. Their average P/E on 2019 consensus is 10 times. Most of the industrial companies we own have a growing percentage of income coming from parts and services, meaning earnings are now less dependent on the more cyclic new equipment sales than they used to be. The consumer businesses, primarily autos, have become global businesses that benefit from rising demand in emerging markets. Our largest cyclical holding, Fiat Chrysler, sells at four times expected earnings. Despite the company’s name, almost all of its profit comes from the growing Jeep and Ram truck brands. And now that the company’s cash exceeds its debt, management expects to begin returning capital through both dividends and share repurchases.
Our next highest weighting is information technology. This is a wide-ranging sector, which includes payment networks (Mastercard and Visa), payroll processing (ADP) and more traditional technology companies, such as Intel and Texas Instruments. But our largest technology position is Apple. Many investors appear to treat Apple as just a consumer electronics company. In contrast, we see Apple as a more valuable integrated hardware, software and services company, which is both a growth company and a value stock. It sells for just 12 times expected earnings (updated for slowing China demand)—11 times if you value its cash separately. That means investors are, incorrectly in our opinion, pricing Apple as a below-average business.
After selling UnitedHealth Group and Medtronic last quarter, health care now accounts for only 10% of our portfolio, including Regeneron, which we mentioned earlier. Unlike many of the high P/E stocks in this sector, our largest holding—CVS Health—sells at only 10 times expected earnings. In November, CVS merged its drugstore business with the health insurer Aetna, based on the belief that sharing facilities and information across the two businesses would lower health care costs and increase profitability. The stock market doesn’t appear to give it any credit for that possibility.
By their absence, you can see we own no utilities, REITs or telecomm services (e.g., AT&T, Verizon) and have very little invested in consumer staples. These companies tend to be viewed as safer than average due to low cyclicality and high dividend payouts. But a low risk business isn’t always a low risk stock. Current P/E multiples that are equal to or higher than the S&P are hard for us to justify, given very modest historical and expected growth. Investors are paying a premium today for low risk businesses and dividends. We think that premium is undeserved.
Empirical Research1 reported that ETF inflows in late 2018 were strongest in utilities, health care and consumer staples. It shouldn’t be surprising that Oakmark has no utility investments or that we have sharply reduced our investments in health care and consumer staples. On the flipside, investors’ least favorite sectors were financials, technology and capital equipment. It’s also no surprise to see those three sectors now account for half of our portfolio.
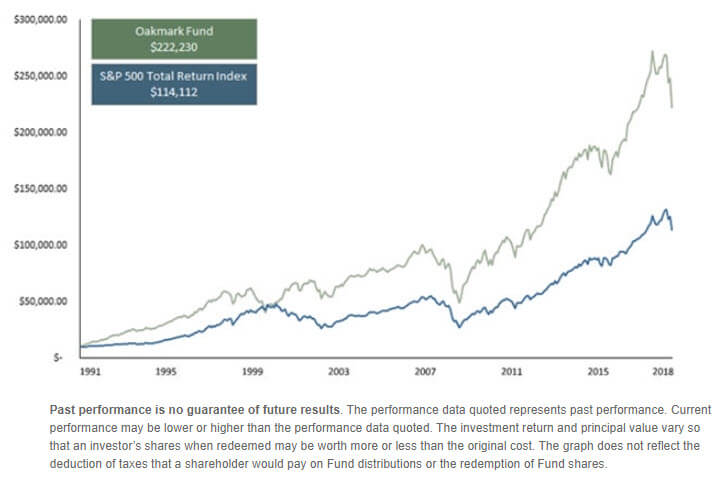
The accompanying graph depicts the growth of a $10,000 investment made when the Oakmark Fund opened in 1991, compared to investing the same amount in the S&P 500. Our 27-year track record is the result of a disciplined process of investing in stocks that appear to be selling at large discounts to value, relative to their long-term earnings potential. Following that philosophy has occasionally made us look foolish, especially when investing for the long term meant avoiding what was then popular. Despite the periods when we were temporarily wrong, that $10,000 has grown to $222,230.
Over the years, some of Oakmark’s people have changed (though many of us have been here from the start) and most of our processes have been tweaked. But we have never wavered from the investment philosophy that is summarized at the top of each of these commentaries:
At Oakmark, we are long-term investors. We attempt to identify growing businesses that are managed to benefit their shareholders. We will purchase stock in those businesses only when priced substantially below our estimate of intrinsic value. After purchase, we patiently wait for the gap between stock price and intrinsic value to close.
The 2018 performance of Oakmark wasn’t what any of us wanted or expected, but given the philosophy that has worked so well for Oakmark, the stocks that are in the portfolio today are the ones you should expect and want us to own.
Average Annual Total Returns (as of 12/31/2018)
| Fund | QTD | 1-Year | 3-Year | 5-Year | 10-Year | Inception |
|---|---|---|---|---|---|---|
| OAKMX | -17.30% | -12.73% | 7.76% | 6.03% | 13.92% | 11.98% |
| S&P 500 Total Return | -13.52% | -4.38% | 9.26% | 8.49% | 13.12% | 9.29% |
Gross Expense Ratio (as of 09/30/2018): 0.89%
Net Expense Ratio (as of 09/30/2018): 0.85%
Fund Inception: 08/05/1991
Past performance is no guarantee of future results. The performance data quoted represents past performance. Current performance may be lower or higher than the performance data quoted. The investment return and principal value vary so that an investor’s shares when redeemed may be worth more or less than the original cost.
The securities mentioned above comprise the following percentages of the Oakmark Fund’s total net assets as of 12/31/18: Ally Financial 2.4%, Alphabet Cl A 0.5%, Alphabet Cl C 3.5%, Apple 2.7%, AT&T Inc. 0%, Automatic Data Processing 1.5%, Bank of America 2.9%, Capital One Financial 2.5%, Citigroup 3.0%, CVS Health 2.4%, Facebook Cl A 1.7%, Fiat Chrysler 2.5%, Gartner 1.4%, Intel 1.9%, Mastercard Cl A 2.0%, Medtronic 0%, MGM Resorts International 1.4%, Netflix 2.7%, News Corp Cl A 1.1%, Regeneron Pharmaceuticals 2.9%, State Street 2.4%, Texas Instruments 1.6%, UnitedHealth Group 0%, Verizon 0% and Visa Cl A 1.7%. Portfolio holdings are subject to change without notice and are not intended as recommendations of individual stocks.
Access the full list of holdings for the Oakmark Fund as of the most recent quarter-end.
1Goldstein, Michael and Zhao, Longying. “Portfolio Strategy December 2018.” Empirical Research Partners. December 20, 2018.
The net expense ratio reflects a contractual advisory fee waiver agreement through January 27, 2020.
The Price-Earnings Ratio (“P/E”) is the most common measure of the expensiveness of a stock.
The S&P 500 Total Return Index is a float-adjusted, capitalization-weighted index of 500 U.S. large capitalization stocks representing all major industries. It is a widely recognized index of broad, U.S. equity market performance. Returns reflect the reinvestment of dividends. This index is unmanaged and investors cannot invest directly in this index.
The Oakmark Fund’s portfolio tends to be invested in a relatively small number of stocks. As a result, the appreciation or depreciation of any one security held by the Fund will have a greater impact on the Fund’s net asset value than it would if the Fund invested in a larger number of securities. Although that strategy has the potential to generate attractive returns over time, it also increases the Fund’s volatility.
Oakmark Select Fund: The stocks of medium-sized companies tend to be more volatile than those of large companies and have underperformed the stocks of small and large companies during some periods.
Because the Oakmark Select Fund is non-diversified, the performance of each holding will have a greater impact on the Fund’s total return, and may make the Fund’s returns more volatile than a more diversified fund.
The discussion of the Funds’ investments and investment strategy (including current investment themes, the portfolio managers’ research and investment process, and portfolio characteristics) represents the Funds’ investments and the views of the portfolio managers and Harris Associates L.P., the Funds’ investment adviser, at the time of this letter, and are subject to change without notice.
All information provided is as of 12/31/2018 unless otherwise specified.