The past quarter has been an important one for Oakmark milestones. In August, we marked the 30th anniversary of the Oakmark Fund, in October we celebrated 15 years of Oakmark Global Select and this month we hit 25 years for Oakmark Select. In a quarterly commentary five years ago, I wrote about why we had the confidence to start the Oakmark family of funds. We thought we could achieve five important goals that were uncommon in the mutual fund industry at that time:
- The Oakmark brand would have meaning: Everything that has the Oakmark name would use a long-term value approach to investing. Today, across our eight funds, we apply that approach to stocks and bonds, U.S. and international stocks, and large and small market capitalizations.
- Oakmark funds would limit diversification: Most mutual funds diversified so much that it was difficult for them to meaningfully outperform the market. We thought our most important skill was security selection, and by limiting our number of holdings we could maximize its impact on our funds.
- Oakmark would produce candid, educational commentary: Most funds viewed shareholder communication as a twice a year legal obligation. We were anxious to communicate with our shareholders and strived to write meaningful quarterly reports.
- Oakmark managers would invest in the funds they managed: We prefer to invest in businesses when managers have substantial personal capital at risk and think our shareholders should have that same expectation of us.
- Oakmark would strive to maximize long-term after-tax total return: Thirty years ago, there were several funds that tried to maximize current yield and many that attempted to maximize capital gains. Few endeavored to maximize total return. Realizing that our shareholders would be using our funds to meet real world financial goals, we not only focused on total return, but on the after-tax return our shareholders would keep.
I’ll let our results speak for themselves, but I’m proud of how each Fund has performed since its inception relative to those initial goals.
| Fund | Performance Since Inception as of 09/30/2021 | Fund Inception Date |
|---|---|---|
| Oakmark Fund S&P 500 Total Return Index | 13.09% 10.55% | 08/05/1991 |
| Oakmark Select Fund S&P 500 Total Return Index | 12.33% 9.58% | 11/01/1996 |
| Oakmark Global Fund MSCI World Index | 10.21% 6.07% | 08/04/1999 |
| Oakmark Global Select Fund MSCI World Index | 8.91% 7.47% | 10/02/2006 |
| Oakmark International Fund MSCI World Index ex U.S. | 9.28% 6.28% | 09/30/1992 |
| Oakmark International Small Cap fund MSCI World ex U.S. Small Cap Index | 9.33% na | 11/01/1995 |
| Oakmark Equity and Income Fund Lipper Balanced Fund Index | 10.22% 7.37% | 11/01/1995 |
| Oakmark Bond Fund Bloomberg Barclays U.S. Aggregate Bond Index | 4.58% 0.11% | 06/10/2020 |
Thanks to all our shareholders who’ve accompanied us on this wonderful journey.
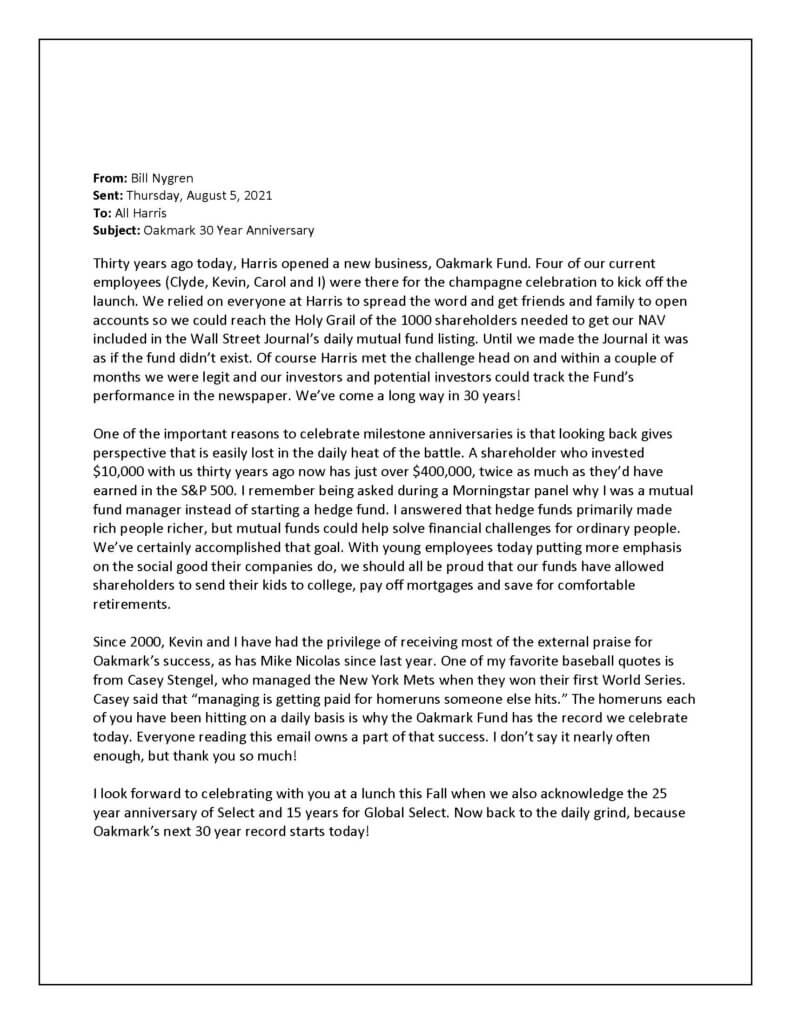
Last, here is a copy of the email I sent to all our employees several months ago when we recognized Oakmark’s 30 year anniversary:
Average Annual Total Returns (as of 03/31/2023):
| Fund | 3 Month | 1 Year | 3 Year | 5 Year | 10 Year | Inception |
|---|---|---|---|---|---|---|
| Oakmark Fund (Investor Class) | 8.10% | -3.82% | 26.81% | 9.67% | 11.71% | 12.36% |
| S&P 500 Total Return Index | 7.50% | -7.73% | 18.60% | 11.19% | 12.24% | 9.95% |
Expense Ratio: 0.89%
Fund Inception: 08/05/1991
To obtain most recent Oakmark Fund month-end performance data, view it here.
| Fund | 3 Month | 1 Year | 3 Year | 5 Year | 10 Year | Inception |
|---|---|---|---|---|---|---|
| Oakmark Select Fund (Investor Class) | 10.91% | -8.77% | 23.55% | 4.89% | 8.69% | 11.08% |
| S&P 500 Total Return Index | 7.50% | -7.73% | 18.60% | 11.19% | 12.24% | 8.91% |
Expense Ratio: 0.98%
Fund Inception: 11/01/1996
To obtain most recent Oakmark Select Fund month-end performance data, view it here.
| Fund | 3 Month | 1 Year | 3 Year | 5 Year | 10 Year | Inception |
|---|---|---|---|---|---|---|
| Oakmark Global Fund (Investor Class) | 10.54% | -2.69% | 22.26% | 5.11% | 7.39% | 9.32% |
| MSCI World Index | 7.73% | -7.02% | 16.40% | 8.01% | 8.85% | 5.44% |
Expense Ratio: 1.11%
Fund Inception: 08/04/1999
To obtain most recent Oakmark Global Fund month-end performance data, view it here.
| Fund | 3 Month | 1 Year | 3 Year | 5 Year | 10 Year | Inception |
|---|---|---|---|---|---|---|
| Oakmark Global Select Fund (Investor Class) | 9.10% | -8.93% | 18.02% | 3.82% | 7.27% | 7.13% |
| MSCI World Index | 7.73% | -7.02% | 16.40% | 8.01% | 8.85% | 6.44% |
Expense Ratio: 1.10%
Fund Inception: 10/02/2006
To obtain most recent Oakmark Global Select Fund month-end performance data, view it here.
| Fund | 3 Month | 1 Year | 3 Year | 5 Year | 10 Year | Inception |
|---|---|---|---|---|---|---|
| Oakmark International Fund (Investor Class) | 13.91% | 5.22% | 21.10% | 1.46% | 5.04% | 8.69% |
| MSCI World ex U.S. Index | 8.02% | -2.74% | 13.49% | 3.80% | 4.91% | 5.81% |
Expense Ratio: 1.04%
Fund Inception: 09/30/1992
To obtain most recent Oakmark International Fund month-end performance data, view it here.
| Fund | 3 Month | 1 Year | 3 Year | 5 Year | 10 Year | Inception |
|---|---|---|---|---|---|---|
| Oakmark International Small Cap Fund (Investor Class) | 6.56% | 2.78% | 22.71% | 3.49% | 5.60% | 8.47% |
| MSCI World ex U.S. Small Cap Index | 4.99% | -10.13% | 13.43% | 1.53% | 5.54% | N/A |
Expense Ratio: 1.34%
Fund Inception: 11/01/1995
To obtain most recent Oakmark International Small Cap Fund month-end performance data, view it here.
| Fund | 3 Month | 1 Year | 3 Year | 5 Year | 10 Year | Inception |
|---|---|---|---|---|---|---|
| Oakmark Equity and Income Fund (Investor Class) | 3.26% | -6.59% | 15.07% | 5.72% | 7.02% | 9.36% |
| Lipper Balanced Fund Index | 4.26% | -6.04% | 9.61% | 5.70% | 6.54% | 6.69% |
Expense Ratio: 0.83%
Fund Inception: 11/01/1995
To obtain most recent Oakmark Equity and Income Fund month-end performance data, view it here.
| Fund | 3 Month | 1 Year | 3 Year | 5 Year | 10 Year | Inception |
|---|---|---|---|---|---|---|
| Oakmark Bond Fund (Institutional Class) | 1.66% | -4.78% | N/A | N/A | N/A | -6.89% |
| Bloomberg Barclays U.S. Aggregate Bond Index | 2.96% | -4.78% | N/A | N/A | N/A | -7.70% |
Gross Expense Ratio: 1.64%
Net Expense Ratio: 0.74%
Fund Inception: 06/10/2020
To obtain most recent Oakmark Bond Fund month-end performance data, view it here.
Expense ratios are as of the Fund’s most recent prospectus dated January 28, 2023; actual expenses may vary.
Returns for periods of less than one year are not annualized.
The Oakmark Bond Fund’s Adviser has contractually undertaken to waive and/or reimburse certain fees and expenses so that the total annual operating expenses of each class are limited to 0.74%, 0.54%, 0.52% and 0.44% of average net assets, respectively. Each of these undertakings lasts until 01/27/2024 and may only be modified by mutual agreement of the parties. The Fund is recently established and has limited operating and performance history.
Past performance is no guarantee of future results. The performance data quoted represents past performance. Current performance may be lower or higher than the performance data quoted. The investment return and principal value vary so that an investor’s shares when redeemed may be worth more or less than the original cost. To obtain the most recent month-end performance data, view it here.
The S&P 500 Total Return Index is a float-adjusted, capitalization-weighted index of 500 U.S. large-capitalization stocks representing all major industries. It is a widely recognized index of broad, U.S. equity market performance. Returns reflect the reinvestment of dividends. This index is unmanaged and investors cannot invest directly in this index.
The Lipper Balanced Fund Index measures the equal-weighted performance of the 30 largest U.S. balanced funds as defined by Lipper. This index is unmanaged and investors cannot invest directly in this index.
The MSCI World Index (Net) is a free float-adjusted, market capitalization-weighted index that is designed to measure the global equity market performance of developed markets. The index covers approximately 85% of the free float-adjusted market capitalization in each country. This benchmark calculates reinvested dividends net of withholding taxes. This index is unmanaged and investors cannot invest directly in this index.
The MSCI World ex U.S. Index (Net) is a free float-adjusted, market capitalization-weighted index that is designed to measure international developed market equity performance, excluding the U.S. The index covers approximately 85% of the free float-adjusted market capitalization in each country. This benchmark calculates reinvested dividends net of withholding taxes. This index is unmanaged and investors cannot invest directly in this index.
The MSCI World ex U.S. Small Cap Index (Net) is designed to measure performance of small-cap stocks across 22 of 23 Developed Markets (excluding the United States). The index covers approximately 14% of the free float-adjusted market capitalization in each country. This benchmark calculates reinvested dividends net of withholding taxes. This index is unmanaged and investors cannot invest directly in this index.
The Oakmark, Oakmark Equity and Income, Oakmark Global, Oakmark International and Oakmark International Small Cap Funds’ portfolios tend to be invested in a relatively small number of stocks. As a result, the appreciation or depreciation of any one security held by the Fund will have a greater impact on the Funds’ net asset value than it would if the Fund invested in a larger number of securities. Although that strategy has the potential to generate attractive returns over time, it also increases the Funds’ volatility.
Because the Oakmark Select Fund and Oakmark Global Select Fund are non-diversified, the performance of each holding will have a greater impact on the fund’s total return, and may make the fund’s returns more volatile than a more diversified fund.
Oakmark Select Fund: The stocks of medium-sized companies tend to be more volatile than those of large companies and have underperformed the stocks of small and large companies during some periods.
The Oakmark Equity and Income Fund invests in medium- and lower-quality debt securities that have higher yield potential but present greater investment and credit risk than higher-quality securities. These risks may result in greater share price volatility. An economic downturn could severely disrupt the market in medium or lower grade debt securities and adversely affect the value of outstanding bonds and the ability of the issuers to repay principal and interest.
Oakmark Equity and Income Fund: The stocks of medium-sized companies tend to be more volatile than those of large companies and have underperformed the stocks of small and large companies during some periods.
The stocks of smaller companies often involve more risk than the stocks of larger companies. Stocks of small companies tend to be more volatile and have a smaller public market than stocks of larger companies. Small companies may have a shorter history of operations than larger companies, may not have as great an ability to raise additional capital and may have a less diversified product line, making them more susceptible to market pressure.
The Oakmark Bond Fund invests primarily in a diversified portfolio of bonds and other fixed-income securities. These include, but are not limited to, investment grade corporate bonds; U.S. or non-U.S.-government and government-related obligations (such as, U.S. treasury securities); below investment-grade corporate bonds; agency mortgage backed-securities; commercial mortgage- and asset-backed securities; senior loans (such as, leveraged loans, bank loans, covenant lite loans, and/or floating rate loans); assignments; restricted securities (e.g., Rule 144A securities); and other fixed and floating rate instruments. The Fund may invest up to 20% of its assets in equity securities, such as common stocks and preferred stocks. The Fund may also hold cash or short-term debt securities from time to time and for temporary defensive purposes.
Under normal market conditions, the Fund invests at least 25% of its assets in investment-grade fixed-income securities and may invest up to 35% of its assets in below investment-grade fixed-income securities (commonly known as “high-yield” or “junk bonds”).
Fixed income risks include interest-rate and credit risk. Typically, when interest rates rise, there is a corresponding decline in bond values. Credit risk refers to the possibility that the bond issuer will not be able to make principal and interest payments.
Bond values fluctuate in price so the value of your investment can go down depending on market conditions.
Investing in foreign securities presents risks that in some ways may be greater than U.S. investments. Those risks include: currency fluctuation; different regulation, accounting standards, trading practices and levels of available information; generally higher transaction costs; and political risks.
Investing in value stocks presents the risk that value stocks may fall out of favor with investors and underperform growth stocks during given periods.
The information, data, analyses, and opinions presented herein (including current investment themes, the portfolio managers’ research and investment process, and portfolio characteristics) are for informational purposes only and represent the investments and views of the portfolio managers and Harris Associates L.P. as of the date written and are subject to change and may change based on market and other conditions and without notice. This content is not a recommendation of or an offer to buy or sell a security and is not warranted to be correct, complete or accurate.
Certain comments herein are based on current expectations and are considered “forward-looking statements”. These forward looking statements reflect assumptions and analyses made by the portfolio managers and Harris Associates L.P. based on their experience and perception of historical trends, current conditions, expected future developments, and other factors they believe are relevant. Actual future results are subject to a number of investment and other risks and may prove to be different from expectations. Readers are cautioned not to place undue reliance on the forward-looking statements.