Oakmark Fund - Investor Class
Average Annual Total Returns 06/30/2025
Since Inception 08/05/91 12.80%
10-year 12.41%
5-year 19.71%
1-year 15.65%
3-month 4.36%
Expense Ratio: 0.89%
Expense ratios are as of the Fund’s most recent prospectus dated January 28, 2025, as amended and restated January 30, 2025, March 14, 2025 and May 19, 2025; actual expenses may vary.
Past performance is no guarantee of future results. The performance data quoted represents past performance. Current performance may be lower or higher than the performance data quoted. The investment return and principal value vary so that an investor’s shares when redeemed may be worth more or less than the original cost. To obtain the most recent month-end performance data, view it here.
Never waste the opportunity offered by a good crisis. -Niccolo Machiavelli
Maybe we should have all just taken the first half of the year off! The S&P 500 is up 6% in six months, a typical increase. But for those of us who watch the markets every day, the path felt anything but typical. The S&P 500 gained 4% through mid-February, lost 10% by mid-March, recovered most of that in late March, and then fell to down 20% on April 8 in reaction to tariff announcements. Yet on June 26, the S&P reached a new high. It was the shortest bear market ever, troughing on the very day it hit down 20%, and it was also the fastest recovery to a new high. U.S. equities went from peak to peak in just 57 trading days, compared to a median of almost two years for the 12 bear markets since 1945.
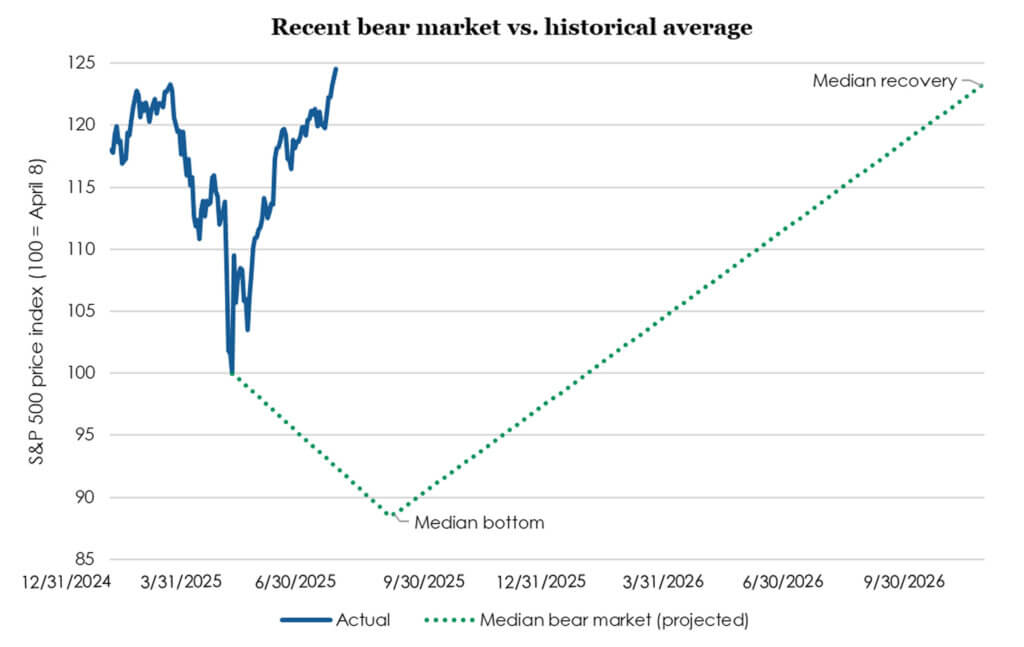
Source: FactSet as of 6/30/2025. Median bear market based on data from 12/31/1945-6/30/2025. Past performance is no guarantee of future results.
Because this has been such an unusual period, I want to recap how we responded. Our process at Oakmark is “bottom-up,” meaning we spend most of our time analyzing individual companies. This contrasts with “top-down” analysis, which focuses on economic variables like GDP and inflation. We’re skeptical of the ability to add value through economic forecasting, so it isn’t a core part of our stock selection. But without some consistent framework for evaluating the economy, we couldn’t properly rank our analysts’ recommendations. Without strong evidence to the contrary, our forecast almost always assumes that the economy will be “normal.” In March, after recession fears had knocked the market down 10%, we reached out to our management teams and asked what they were seeing. They said growth continued to be very good despite weakening sentiment. In the coming months, they expected that either sentiment would improve, or growth would slow. Given that information, we felt comfortable maintaining our 2025 forecast for normal economic growth.
Then came “Liberation Day” and the market panic. Many investors prefer to stand on the sidelines during market chaos because they don’t have enough conviction to warrant making trades. We’ve found that early in bear markets, stock prices are not usually driven by individual company valuations, but rather on quickly reducing portfolio risk. This reaction creates a good pond for us to fish in. As a result, we are usually much more active during early bear markets since we believe unusually wide valuation spreads more than compensate for the increased uncertainty. History suggests that some of our most value-added work has occurred during these stressful periods.
We went to a playbook we’ve used before, most recently when inflation spooked the market in 2022 and during the Covid scare of 2020. We first asked our analysts to rework their earnings models anticipating a weaker 2025 economy. Because that could bleed into 2026, we also had them forecast 2027 so that our ranking of attractiveness would be based on normal earnings. Additionally, we had analysts assign each company a tariff exposure rating from one to five so that we could avoid unintentionally increasing tariff risk. For Oakmark Fund, Mike, Bobby and I penciled out what a new portfolio would look like if we were starting from cash. Then we got to work.
The Monday after “Liberation Day,” we embarked on a plan to reposition nearly one-third of the portfolio over the next ten weeks. This timeframe gave us sufficient opportunity to react to rapidly changing information. Plus, a typical bear market lasts for about four months before it hits bottom. So, armed with our updated rankings, we began attacking the biggest valuation spreads.
For the next two weeks, we were about five times as active as normal. We added Nike and Amazon, and we increased our holdings in companies like Airbnb, Carlyle Group and GE Healthcare. The stocks we bought had declined an average of 28% since the market’s February peak. To fund these purchases, we needed to sell other holdings, so we eliminated our position in Kroger at our sell target. We also reduced other holdings that were closing in on our sell targets, such as AIG Group, Corteva, CVS and Kenvue. The stocks we sold were down by an average of only 2% despite the S&P 500 having lost 20%. The chart below shows how well these early trades worked: our buys nearly reversed their decline, far outperforming our sales.
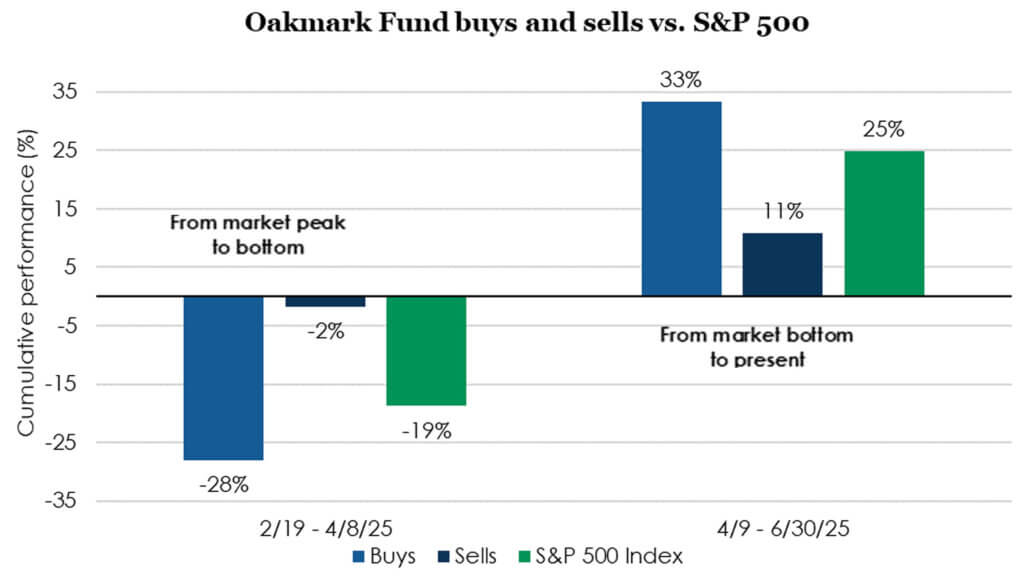
Source: FactSet. Buys/sells include holdings that had at least a 10% change between 3/31/25-4/15/25. Past performance is no guarantee of future results.
But the market surprised us by recovering unusually quickly. This was unfortunate in a way, because the portfolio changes we made worked so well. In hindsight, had we known the bear market was over, we’d have moved faster.
One of our holdings, Keurig Dr. Pepper (KDP), illustrates how we took advantage of stocks that moved independently from the market. We added to our KDP position in January at $31. At the market peak on February 19, KDP closed at $33. But at the market bottom on April 8, with the S&P down 20%, KDP had risen slightly to $34. At that price, it looked less attractive than most of our portfolio, and we started selling. When the S&P hit a new high, up 25% from the bottom, KDP had declined to $33, looked more attractive than most of our portfolio, and we again added.
Finally, I want to mention taxes. Part of our elevated trading was from tax loss harvesting, a tool that can benefit all our shareholders by reducing capital gains distributions and the costs of related outflows and inflows. Tax loss harvesting throughout the year, rather than waiting until year end, allowed us to take advantage of April’s unusually fleeting opportunity. With the mutual fund tax year now two-thirds over, I’m pleased to say that we expect another year of zero capital gains distributions for all our funds in 2025, with the exception of Oakmark International Small Cap Fund.
Now what?
Last quarter, we asked, “The S&P 500 has corrected: Now what?” Today we ask, “The S&P 500 has recovered: Now what?” The answer is the same:
“Though we aren’t market timers at Oakmark, we are fans of periodic portfolio rebalancing. We think it makes sense to set target portfolio weightings for stocks, bonds and cash, and within the stock portion, to further target U.S. and international exposure. Especially after large moves, it is possible to take advantage of volatility by trimming the outperforming categories and adding to the underperforming ones. This can help prevent an ever-increasing exposure to one asset as its price gets more and more expensive. Further, it establishes the pattern that you can take advantage of inevitable periods of weakness to increase your holdings in undervalued assets. This behavior goes a long way toward reducing, if not eliminating, the counterproductive temptation to sell after declines.”
Those who rebalanced near the April bottom probably now have more equity exposure than they are comfortable with, and rebalancing would allow them to trim equities and increase fixed income. As an aside, unlike the 2022 bear market, when bonds declined as much as equities did, the 10-year United States Treasury bond returned 3% during the 2025 bear market, meaning bonds played their typical risk-mitigation role in balanced portfolios. As Alex Fitch wrote during the quarter (“Curb your Enthusiasm”), the Oakmark Equity and Income Fund, a blend of stocks and bonds for investors who prefer one-stop shopping, has historically achieved its goal of reducing the risk of an all equity portfolio more than it reduces return, unlike many of today’s trendy reduced-risk products. And those of you who prefer to manage your own asset allocation might consider Oakmark Bond Fund, a five-star Morningstar-rated offering1.
We warn about market timing because it is so hard to get both the sale and purchase correct, and the cost of missing out can be high. An investor who invested $10,000 in the S&P 500 in 1950, would have $40 million today. And if they switched that to the Oakmark Fund when it started in 1991, they would have $76 million. How much attention do you want to devote to improving on those returns by trying to time the market? That’s why we suggest sticking to a plan that consistently maximizes equity exposure while staying within personal risk tolerances.
OPINION PIECE. PLEASE SEE ENDNOTES FOR IMPORTANT DISCLOSURES.
Important Disclosures
1Morningstar star rating portrays the Overall Morningstar Rating for Oakmark Bond Fund (Institutional Share Class) in the Intermediate Core-Plus Bond fund category out of 540 funds as of 5/31/2025 based on risk-adjusted returns; other classes may have different performance characteristics and star ratings. The Fund’s 3-year Morningstar Rating is also 5 Stars out of 540 funds.
For each fund with at least a three-year history, Morningstar calculates a Morningstar Rating based on a Morningstar Risk-Adjusted Return measure that accounts for variation in a fund’s monthly performance (including the effects of sales charges, loads, and redemption fees), placing more emphasis on downward variations and rewarding consistent performance. The top 10% of funds in each category receive 5 stars, the next 22.5% receive 4 stars, the next 35% receive 3 stars, the next 22.5% receive 2 stars and the bottom 10% receive 1 star. (Each share class is counted as a fraction of one fund within this scale and rated separately, which may cause slight variations in the distribution percentages.) The Overall Morningstar Rating for a fund is derived from a weighted average of the performance figures associated with its three-, five- and ten-year (if applicable) Morningstar Rating metrics. As of 5/31/25, Oakmark Bond Fund – Institutional Share Class OANCX was rated against 540, U.S. domiciled funds in the Intermediate Core-Plus Bond category and received 5 stars for the 3-year period. Past performance is no guarantee of future results. © 2025 Morningstar, Inc. All Rights Reserved. The information contained herein: (1) is proprietary to Morningstar; (2) may not be copied or distributed; and (3) is not warranted to be accurate, complete or timely. Neither Morningstar nor its content providers are responsible for any damages or losses arising from any use of this information.
The securities mentioned above comprise the following percentages of the Oakmark Fund’s total net assets as of 06/30/2025: Airbnb Cl A 2.2%, Amazon.com 1.6%, American Intl Group 2.2%, Carlyle Group 1.4%, Corteva 1.4%, CVS 0.0%, GE Healthcare Tech 1.6%, Kenvue 0.3%, Keurig Dr Pepper 1.9%, Kroger 0.0% and Nike Cl B 1.8%. Portfolio holdings are subject to change without notice and are not intended as recommendations of individual stocks. The Funds disclaim any obligation to advise shareholders of such changes. Information about portfolio holdings does not represent a recommendation or an endorsement to Fund shareholders or other members of the public to buy or sell any security contained in the Funds’ portfolios. Portfolio holdings are current to the date listed but are subject to change any time. There are no assurances that the securities will remain in the Funds’ portfolios after the date listed or that the securities that were previously sold may not be repurchased.
Access the full list of holdings for the Oakmark Fund here.
The information, data, analyses, and opinions presented herein (including current investment themes, the portfolio managers’ research and investment process, and portfolio characteristics) are for informational purposes only and represent the investments and views of the portfolio managers and Harris Associates L.P. as of the date written and are subject to change and may change based on market and other conditions and without notice. This content is not a recommendation of or an offer to buy or sell a security and is not warranted to be correct, complete or accurate.
Certain comments herein are based on current expectations and are considered “forward-looking statements.” These forward looking statements reflect assumptions and analyses made by the portfolio managers and Harris Associates L.P. based on their experience and perception of historical trends, current conditions, expected future developments, and other factors they believe are relevant. Actual future results are subject to a number of investment and other risks and may prove to be different from expectations. Readers are cautioned not to place undue reliance on the forward-looking statements.
This material is not intended to be a recommendation or investment advice, does not constitute a solicitation to buy, sell or hold a security or an investment strategy, and is not provided in a fiduciary capacity. The information provided does not take into account the specific objectives or circumstances of any particular investor, or suggest any specific course of action. Investment decisions should be made based on an investor’s objectives and circumstances and in consultation with his or her financial professionals.
The S&P 500 Index is a float-adjusted, capitalization-weighted index of 500 U.S. large-capitalization stocks representing all major industries. It is a widely recognized index of broad, U.S. equity market performance. Returns reflect the reinvestment of dividends. This index is unmanaged and investors cannot invest directly in this index.
The Oakmark Equity and Income Fund invests in medium- and lower-quality debt securities that have higher yield potential but present greater investment and credit risk than higher-quality securities. These risks may result in greater share price volatility. An economic downturn could severely disrupt the market in medium or lower grade debt securities and adversely affect the value of outstanding bonds and the ability of the issuers to repay principal and interest.
The Oakmark Equity and Income Fund’s portfolio tends to be invested in a relatively small number of securities. As a result, the appreciation or depreciation of any one security held by the Fund will have a greater impact on the Fund’s net asset value than it would if the Fund invested in a larger number of securities. Although that strategy has the potential to generate attractive returns over time, it also increases the Fund’s volatility.
Oakmark Equity and Income Fund: The securities of medium-sized companies tend to be more volatile than those of large companies and have underperformed the securities of small and large companies during some periods.
The Oakmark Bond Fund invests primarily in a diversified portfolio of bonds and other fixed-income securities. These include, but are not limited to, investment grade corporate bonds; U.S. or non-U.S.-government and government-related obligations (such as, U.S. treasury securities); below investment-grade corporate bonds; agency mortgage backed-securities; commercial mortgage- and asset-backed securities; senior loans (such as, leveraged loans, bank loans, covenant lite loans, and/or floating rate loans); assignments; restricted securities (e.g., Rule 144A securities); and other fixed and floating rate instruments. The Fund may invest up to 20% of its assets in equity securities, such as common stocks and preferred stocks. The Fund may also hold cash or short-term debt securities from time to time and for temporary defensive purposes.
Under normal market conditions, the Fund invests at least 25% of its assets in investment-grade fixed-income securities and may invest up to 35% of its assets in below investment-grade fixed-income securities (commonly known as “high-yield” or “junk bonds”).
Fixed income risks include interest-rate and credit risk. Typically, when interest rates rise, there is a corresponding decline in bond values. Credit risk refers to the possibility that the bond issuer will not be able to make principal and interest payments.
Bond values fluctuate in price so the value of your investment can go down depending on market conditions.
The Oakmark Funds’ portfolios tend to be invested in a relatively small number of securities. As a result, the appreciation or depreciation of any one security held by the Fund will have a greater impact on the Fund’s net asset value than it would if the Fund invested in a larger number of securities. Although that strategy has the potential to generate attractive returns over time, it also increases the Fund’s volatility.
Investing in value stocks presents the risk that value stocks may fall out of favor with investors and underperform growth stocks during given periods.
All information provided is as of 06/30/2025 unless otherwise specified.