Harris Associates will turn 47 years old this year. That may not sound like much by human standards, but investment management firms tend to live in dog years. Many of our original peers no longer exist today.
This durability is all the more surprising when you realize how little our firm has changed since its founding. In 1976, we set out with the goal of building wealth for our clients over the long term–and that remains our north star. Our investment philosophy is similarly unchanged: buy businesses at a significant discount to our estimate of intrinsic value, invest in companies expected to grow per share value, and invest with management teams that think and act as owners. The places in which we find value are constantly evolving, but our dedication to value investing is unwavering. In other words, we have not survived because we pivoted–we may have survived because we didn’t.
The investing world, meanwhile, has changed dramatically over the past 47 years. Passive investing was a rounding error 47 years ago; today, total passive fund assets in the U.S. are approaching parity with total active fund assets. The computing power for modern quant funds did not even exist back in 1976! Today, quant funds can capture and react to new information nearly instantaneously. Meanwhile, ubiquitous financial data has allowed quantitative measures of volatility to be broadly incorporated into investment decision making.
It’s worth asking, what would one expect to see happen to market prices with all this change? You would probably expect to see higher correlation across stocks as passive flows drive prices up and down together. You might also expect to see individual stock returns increasingly determined by common drivers, as quantitative investors group stocks into “style” indexes and trade in “factor” baskets. And you would probably expect to see an increased premium placed on low beta stocks as investors now broadly incorporate such metrics into their assessment of risk.
As it turns out, that is exactly what has happened. Over the past three decades, average correlation among S&P 500 stocks has increased and, in recent years, has been sitting well above historic averages.1 Research suggests this is related to the prevalence of ETFs, with greater ETF ownership of constituent stocks leading to greater correlation between those stocks.2 Other research suggests individual stock returns are increasingly determined by common drivers like “growth” or “value” classification.3 Finally, and perhaps most importantly, there has been a growing premium placed on lower beta stocks, with the lowest beta quintile of the S&P 500 trading at a historically large premium to the highest beta quintile in recent years.
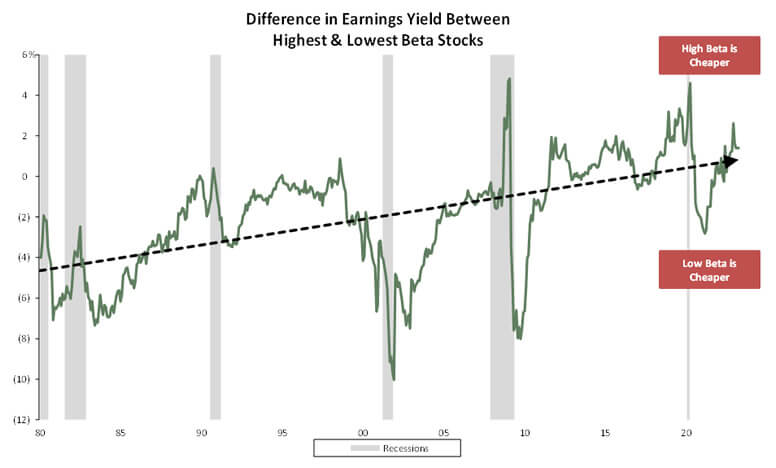
Large capitalization stocks. Top vs bottom beta quintile. Equal-weighted.
Source: National Bureau of Economic Research, Empirical Research Partners analysis; Large-capitalization stocks: top vs. bottom beta quintile; equal weighted.
Date range: January 1980 Through Mid-April 2023
What is even more intriguing is that these trends do not seem to be justified by a change in business fundamentals. Stock prices may behave more similarly today, but business fundamentals seem to vary just as widely as they always have. In fact, the gap between the growth rates of the fastest and slowest growing quintiles of the S&P 500 have been roughly the same as they were 20 to 30 years ago. Same goes for the “growth” and “value” style labels, which purport to distinguish stocks based on fundamentals but which have led to higher correlations within style groupings than are justified by the financials.4
Finally, those high beta stocks that trade at an unusually large discount today don’t seem to have performed any worse fundamentally than the lower beta stocks that trade at a premium. In fact, the highest beta quintile of stocks in the S&P 500 have actually grown earnings per share faster than the average S&P 500 company over the past five years!
Whenever we see such a disconnect between stock prices and business fundamentals, it gets our attention. After all, in the long term, stock prices should converge with business values. When prices and values become untethered, it creates opportunity.
To be clear, we are (and always have been) bottom-up value investors. We don’t form a macro view and then search for ideas that fit our narrative. Instead, we spend our days scouring the investable universe for opportunities to buy businesses at a discount. This bottom-up process manifests itself in different ways over time: some 30 years ago it led to large holdings in low-beta stocks, like H.J. Heinz and Lockheed Martin; today it is unearthing ideas that take advantage of very different trends in the market. The ideas we are finding today can generally be grouped under a few recurring themes:
Theme #1 – When beta distracts from long-term earnings power
When the market values high beta stocks at a discount, there is opportunity to buy those business that are being overly penalized. CBRE is one such example in our portfolios. In our view, the company has a competitive moat and growth outlook that rival those of more stable business services peers, like Aon and Accenture, but the company trades at a 35% discount to these peers on next year’s earnings due to cyclical fears. In our opinion, the opportunity to buy this comparable quality business at a discounted multiple is a recipe for excess returns. As Warren Buffett once put it, “I would rather earn a lumpy 15% over time than a smooth 12%.” We tend to agree.
Theme #2 – When the market has a stale perception of industry risk
In a market that relies on quantitative measures of price volatility to gauge risk, there is opportunity to identify businesses where fundamentals have evolved such that market perception is stale. The big banks, for instance, have vastly improved their balance sheets since the global financial crisis. They more than doubled their total loss-absorbing capital since 2006 while reducing lending risk and improving liquidity. These actions have vastly enhanced the big banks’ ability to endure downturns. The recent banking crisis helps illustrate this point. In the global financial crisis, the big banks needed to be saved. This time, they were the saviors. Yet, the stocks trade at substantially lower multiples today than they did before the global financial crisis. If we are right about the way these businesses have improved, the valuations are hard to justify.
Theme #3 – When lock-step price changes create opportunity to buy quality
When the market paints with an overly broad brush–treating all stocks in an industry similarly despite fundamental differences–there is opportunity to identify the highest quality companies that are being inappropriately penalized. The recent banking crisis surfaced a few such examples, with broad-based declines in bank stocks leading to possibilities to buy high-quality franchises at bargain prices. Truist Financial and Charles Schwab Corp are two examples of recent purchases that fit the bill.
We’ve seen something similar occur in energy, where recent oil price weakness has weighed on the shares of most oil producers. The market doesn’t seem to have sufficiently differentiated between low-cost producers with plentiful inventory and high-cost producers with minimal inventory. We’ve taken advantage of this situation, adding to our holdings in best-in-class producers, like ConocoPhillips and EOG Resources.
Theme #4 – When hard-to-quantify datapoints matter most
When every numerical datapoint about a business is being captured in a quant model, there is opportunity to focus on attributes that are hard to quantify, like management quality and capital allocation. First Citizens BancShares is a holding that captures this theme in action. We became intrigued by First Citizens after the company announced its 2020 acquisition of CIT group, a deal that bolstered tangible book value per share by almost 70% in just 15 months. We initiated a position after we came to appreciate the quality of the management team and their track record of excellent capital allocation. Although we certainly didn’t predict it, our confidence in management was rewarded when First Citizens acquired Silicon Valley Bank out of FDIC receivership earlier this year. The deal added 100% to First Citizens’s tangible book value per share in one fell swoop (and drove a similar increase in the stock price). This outcome is a good reminder of the Albert Einstein truism that “not everything that can be counted counts and not everything that counts can be counted.”
Easy in theory–hard in practice
“There’s an inherent conflict between the profession of investing and the business of investing.”
-Charles Ellis
The trouble, of course, is that it is much easier to talk about taking advantage of these opportunities than to actually do so. This is especially true in a world of higher correlations, in which it may take longer for the gap between price and intrinsic value to close. It can be hard to maintain conviction when the market keeps suggesting you are wrong. Even the most battle-tested investors can be swayed by stock price movements and persuaded to change their stripes at precisely the wrong time. Moreover, even if an investment manager can maintain discipline, its clients may feel differently. The result is that investment managers are often forced to choose between prioritizing the long-term investment results of their clients and the short-term profits of their business. Unfortunately, far too many managers choose the latter.
We saw this dynamic play out during the tech bubble in 1999, when the headlines were filled with reports of notable value investors abandoning their discipline to join the mania just before the peak. We saw it in 2008, when peers retreated to hide in “safe” securities just before the rebound. And we saw it most recently in the Covid-19 crisis when investors alternated between panic around lockdowns and euphoria around the technology enabling them. In each case, a focus on short-term business interests worked against long-term client interests.
Our history is different. We stuck to our knitting in the tech bubble, prioritizing long-term investment returns over short-term business profits. From peak to trough, it cost us 38% of our assets under management. We made the same decision in 2008 and saw a 53% decline in assets under management. In 2020, the figure was 25%.
In each case, however, our decision was eventually rewarded. In the three years after our assets troughed in 2000, the Oakmark Fund outperformed the S&P 500 by some +90ppts. In the three years after our assets troughed during the global financial crisis, the Oakmark Fund outperformed the S&P 500 by +14ppts. And in the three years after our assets troughed in 2020, the Oakmark Fund outperformed the S&P 500 by +22ppts. The business, of course, eventually followed the investment results. We were left with newfound appreciation for the quote from Horace that Ben Graham used to open Security Analysis: “Many shall be restored that now are fallen and many shall fall that now are in honor.”
It should come as no surprise that we continue to stick to our knitting today. We still focus on identifying the most undervalued investments in the market and wait patiently for the gap between price and value to close. If this process takes a little longer than it did in the past, we won’t get antsy. By investing in businesses with growing per share value and aligned management teams, time is on our side. We’re also willing to take on volatility when we see opportunity for outsized returns, even as the world moves in the opposite direction. This approach may be deemed “risky” by many. But we would rather take on short-term price risk than fail to achieve our primary goal–the same goal we had 47 years ago: build wealth for our clients over the long term.
1Leippold, Markus, Lujing Su, and Alexandre Ziegler. “How index futures and ETFs affect stock return correlations.” Working Paper (2016). Available at SSRN 2620955
2Da, Zhi, and Sophie Shive. “Exchange traded funds and asset return correlations.” European Financial Management 24, no. 1 (2018): 136-168.
3Boyer, Brian H. “Style-related comovement: Fundamentals or labels?.” The Journal of Finance 66, no. 1 (2011): 307-332.
4Ibid.
Average Annual Total Returns (as of 06/30/2023):
| Fund | 3 Month | 1 Year | 3 Year | 5 Year | 10 Year | Inception |
|---|---|---|---|---|---|---|
| OAKMX | 8.64% | 27.11% | 21.67% | 11.03% | 12.05% | 12.55% |
| S&P 500 Total Return Index | 8.74% | 19.59% | 14.60% | 12.31% | 12.86% | 10.16% |
Fund Inception: 08/05/1991
Expense Ratio: 0.89%
Expense ratios are as of the Fund’s most recent prospectus dated January 28, 2023; actual expenses may vary.
Returns for periods of less than one year are not annualized.
To obtain most recent Oakmark Fund month-end performance data, view it here.
Past performance is no guarantee of future results. The performance data quoted represents past performance. Current performance may be lower or higher than the performance data quoted. The investment return and principal value vary so that an investor’s shares when redeemed may be worth more or less than the original cost.
The holdings mentioned comprise the following percentages of total net assets as of 05/31/2023:
| Security | Oakmark Fund |
|---|---|
| AON | 0% |
| Accenture | 0% |
| CBRE | 2.2% |
| Charles Schwab | 1.7% |
| ConocoPhillips | 2.5% |
| EOG Resources | 2.3% |
| First Citizens BancShares | 0% |
| H.J. Heinz | 0% |
| Silicon Valley Bank | 0% |
| Truist Financial | 1.4% |
Portfolio holdings are not intended as recommendations of individual stocks and are subject to change. The Funds disclaim any obligation to advise shareholders of such changes. Information about portfolio holdings does not represent a recommendation or an endorsement to Fund shareholders or other members of the public to buy or sell any security contained in the Funds’ portfolios. Portfolio holdings are current to the date listed but are subject to change any time. There are no assurances that the securities will remain in the Funds’ portfolios after the date listed or that the securities that were previously sold may not be repurchased.
Access the full list of holdings for the Oakmark Fund here.
The S&P 500 Total Return Index is a float-adjusted, capitalization-weighted index of 500 U.S. large-capitalization stocks representing all major industries. It is a widely recognized index of broad, U.S. equity market performance. Returns reflect the reinvestment of dividends. This index is unmanaged and investors cannot invest directly in this index.
Book Value refers to a company’s common stock equity as it appears on a balance sheet, equal to total assets minus liabilities, preferred stock, and intangible assets such as goodwill.
Investing in value stocks presents the risk that value stocks may fall out of favor with investors and underperform growth stocks during given periods.
Performance data presented represents past performance; past performance does not guarantee future results. The investment return and principal value of an investment will fluctuate so that an investor’s shares, when redeemed, may be worth more or less than their original cost. Current performance may be lower or higher than the performance data quoted. All returns reflect the reinvestment of dividends and capital gains and the deduction of transaction costs.
The information, data, analyses, and opinions presented herein (including current investment themes, the portfolio managers’ research and investment process, and portfolio characteristics) are for informational purposes only and represent the investments and views of the portfolio managers and Harris Associates L.P. as of the date written and are subject to change and may change based on market and other conditions and without notice.
Certain comments herein are based on current expectations and are considered “forward-looking statements”. These forward looking statements reflect assumptions and analyses made by the portfolio managers and Harris Associates L.P. based on their experience and perception of historical trends, current conditions, expected future developments, and other factors they believe are relevant. Actual future results are subject to a number of investment and other risks and may prove to be different from expectations. Readers are cautioned not to place undue reliance on the forward-looking statements.
The discussion of investments and investment strategy of the Funds (including current investment themes, the portfolio manager’s research and investment process and portfolio characteristics) represents the investments of the Funds and the views of the portfolio managers and Harris Associates L.P., the Fund’s investment adviser, and are subject to change without notice.