Oakmark Fund - Investor Class
Average Annual Total Returns 12/312025
Since Inception 08/05/91 12.86%
10-year 13.71%
5-year 15.04%
1-year 14.11%
3-month 4.78%
Expense Ratio: 0.89%
Expense ratios are as of the Fund’s most recent prospectus dated January 28, 2025, as amended and restated January 30, 2025, March 14, 2025 and May 19, 2025; actual expenses may vary.
Past performance is no guarantee of future results. The performance data quoted represents past performance. Current performance may be lower or higher than the performance data quoted. The investment return and principal value vary so that an investor’s shares when redeemed may be worth more or less than the original cost. To obtain the most recent month-end performance data, view it here.
What goes up must come down.
-Sir Isaac Newton
Many of the old Wall Street sayings assume trends eventually have to reverse: “Trees don’t grow to the sky”; “Bulls can make money, bears can make money, but pigs get slaughtered”; “You can’t go broke taking a profit.” Even the advice we consistently offer—to periodically rebalance portfolios—is because a higher stock price increases potential loss and decreases potential gain. But the past few years have made a mockery of that advice, leading millions of investors to conclude that it is outdated and irrelevant.
Despite generating better-than-average absolute returns, actively managed funds have recently had a difficult time beating the S&P 500. It has been especially difficult for managers like us, who focus on business value. Although our equity funds earned double-digit, tax-efficient returns and reached new all-time highs in 2025, most trailed the S&P 500. But a remarkably simple strategy produced nearly double the S&P return in 2025: Buy the stocks that have already gone up the most! Just buy those stocks, sit back, and rebalance quarterly.
This chart shows the results for a portfolio of all mid- and large-cap stocks that were in the top quintile of trailing nine-month returns.
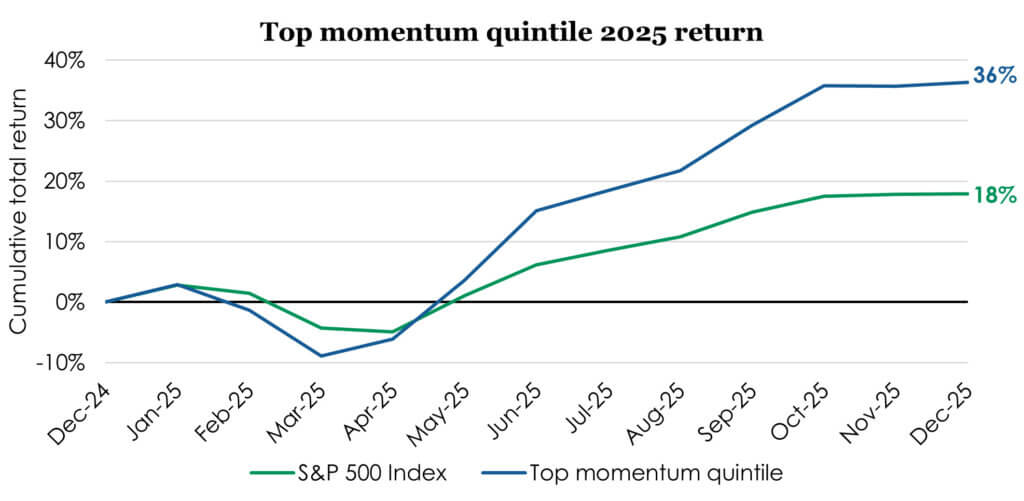
See disclosure under the following related chart.
And this comes on the heels of a very similar 2024. Below is the two-year chart.
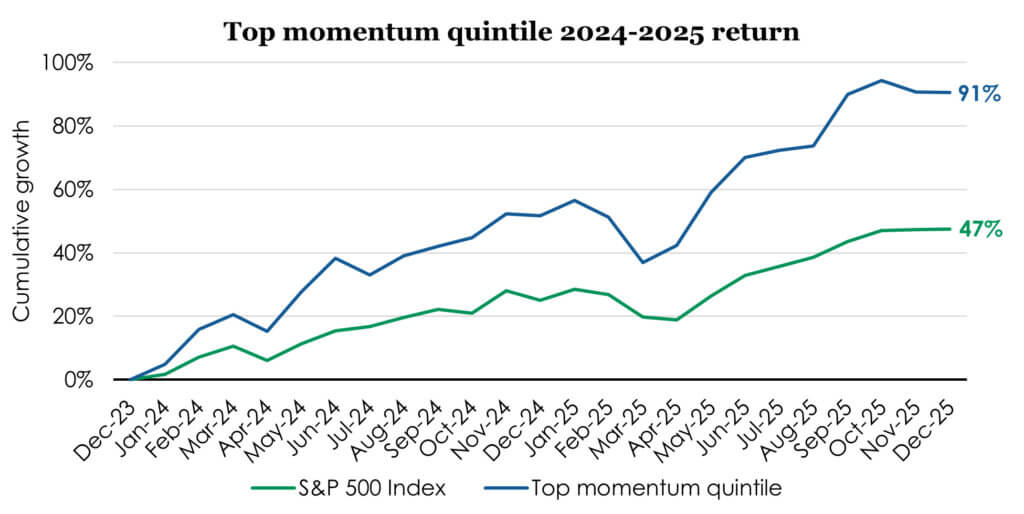
Data source: Morningstar Direct as of 12/31/2025. The universe for this analysis is all U.S. stocks classified as mid-cap, large-cap, or giant-cap by Morningstar. Momentum is defined for each individual stock as the 9-month trailing return on a 1-month lag. The ‘top momentum quintile’ portfolio is rebalanced quarterly and market-cap weighted. The portfolio is constructed on a quarterly basis by only selecting stocks whose momentum score fall within the top quintile of the universe. In order to avoid hindsight bias, stocks are selected after their 9-month return is realized and are held in the portfolio for 3 months thereafter until the next quarterly rebalance occurs. Past performance is no guarantee of future results. Charts are for informational purposes only and do not depict the performance of any Harris | Oakmark strategy or product.
So, for the past two years, investors have been rewarded for believing, “What goes up keeps going up.” And investors like us, who use profits from high-performing stocks to reinvest in cheaper stocks, have missed out on the biggest gains. As more investors jump aboard the momentum train, it is especially important to use historical context to understand recent performance. This chart shows the top performing two-year periods for momentum since 1998.
| Strongest momentum 2-year performance periods since 1998 (non-annualized) | ||||
|---|---|---|---|---|
| Time period | Top momentum quintile | S&P 500 Index | Momentum excess | |
| 1 | 1998-1999 | 130% | 56% | 75% |
| 2 | 2024-2025 | 91% | 47% | 43% |
| 3 | 2023-2024 | 92% | 58% | 35% |
| 4 | 2001-2002 | -11% | -31% | 20% |
| 5 | 2006-2007 | 33% | 22% | 11% |
Source: Morningstar Direct as of 12/31/2025. Past performance is no guarantee of future results.
The dot-com bubble was easily the strongest two years for momentum, but the past two years are the next highest. And if you add 2023, the past three years cumulatively came very close to the dot-com era. Prior to this, the next strongest period for momentum was after the collapse of the dot-com bubble. That’s when the non-technology stocks that were left behind in 1998 and 1999 enjoyed a multi-year recovery. I’m hoping that is foreshadowing because that was an exceptionally favorable time for Oakmark performance!
Looking at the past 20 years, shown as four periods of five years each, it becomes even clearer that the current period is an outlier.
| Strongest momentum 5-year performance periods over past 20 years (non-annualized) | |||
|---|---|---|---|
| Time period | Top momentum quintile | S&P 500 Index | Momentum excess |
| 2021-2025 | 151% | 96% | 55% |
| 2016-2020 | 106% | 103% | 3% |
| 2011-2015 | 75% | 81% | -6% |
| 2006-2010 | 9% | 12% | -3% |
Source: Morningstar Direct as of 12/31/2025. Past performance is no guarantee of future results.
The unusual momentum of the past few years has also caused the spread between the “haves” and “have-nots” to keep growing. Because the heaviest weighted stocks in the S&P 500 were mostly in the positive momentum category, the gap between the S&P 500 multiple and the multiple of the average stock has widened. Since the end of 2022, the S&P 500 P/E multiple has increased by 5 points, from 17 to 22 times earnings, or 31%. But the multiple of the average stock has only increased by one multiple point, or 7%. When we look at the performance of average stocks compared to stock market averages, we see opportunity.
Very little of the Oakmark Fund is invested in the stocks that are most heavily weighted in the S&P 500, the same stocks that have pushed the S&P’s P/E ratio higher. The Oakmark Fund’s P/E ratio of 13 times is, as it typically has been historically, well below that of the average stock. But, because of how low the average stock P/E is today compared to the S&P 500, Oakmark has rarely had such a low relative P/E ratio.
We believe that the Oakmark Fund is an attractive standalone portfolio. (Of course, we always believe that!) With the Oakmark Fund trading at about 13 times expected earnings, its risk profile is quite different from the S&P 500. And we find that exciting. Academics say that the only way to increase expected return on an investment is to take on more risk. We’ve always disagreed. Since its inception, Oakmark has returned more than its risk level suggested. We attribute this to our consistent investment style of buying at a discount to fair value in order to simultaneously increase upside and decrease downside. We believe that Oakmark’s low P/E today relative to the S&P 500 increases the likelihood that record continues.
Perhaps more important, our portfolio has never looked so unlike the S&P 500. The make-up of the S&P 500 has changed dramatically in just the past few years. It has become higher priced and more concentrated than at any time in recent history. Oakmark’s largest holding is less than 3% of its portfolio while the S&P 500’s largest is over 7%. Less than 5% of the Oakmark portfolio is in technology stocks while the S&P has approximately 35%. That’s more than Oakmark holds in any single industry.
Because of the S&P’s unusually high concentrations, Oakmark’s correlation to the index is at its lowest level since the dot-com bubble. The math of portfolio construction shows that risk declines when the assets composing a portfolio are less correlated to each other. (As an example, consider the risk reduction from owning both an oil producer and an oil consumer rather than two of either.) Today, Oakmark provides more portfolio diversification benefit than it has at any point this century—both because it is more diversified than the S&P 500 and because its correlation is historically low.
We no longer view the S&P 500 as a low risk, “buy and hold” investment. We believe, and the data confirm, that the S&P 500 has become much riskier and therefore more akin to a concentrated growth fund. As a result, we think investors should re-examine whether their exposure to the S&P 500 is consistent with meeting their long-term financial goals. For those investors who have the majority of their assets indexed to the S&P 500, we believe there is an unusual opportunity to both increase expected return and lower risk by replacing some of the S&P 500 exposure with a fund like the Oakmark Fund.
Maybe “this time is different,” and “pigs won’t get slaughtered,” and “trees will grow to the sky.” But if, as we believe, “what goes up still must come down,” then Oakmark is very well-positioned for 2026 and beyond.
With the new year just beginning, all of us at Harris | Oakmark would like to take this opportunity to thank you for trusting us to invest your savings. It is a privilege we don’t take for granted and a responsibility we don’t take lightly. We all wish you a happy, healthy and prosperous 2026.
OPINION PIECE. PLEASE SEE ENDNOTES FOR IMPORTANT DISCLOSURES.
Important Disclosures
This material is not intended to be a recommendation or investment advice, does not constitute a solicitation to buy, sell or hold a security or an investment strategy, and is not provided in a fiduciary capacity. The information provided does not take into account the specific objectives or circumstances of any particular investor, or suggest any specific course of action. Investment decisions should be made based on an investor’s objectives and circumstances and in consultation with his or her financial professionals.
The information, data, analyses, and opinions presented herein (including current investment themes, the portfolio managers’ research and investment process, and portfolio characteristics) are for informational purposes only and represent the investments and views of the portfolio managers and Harris Associates L.P. as of the date written and are subject to change and may change based on market and other conditions and without notice. This content is not a recommendation of or an offer to buy or sell a security and is not warranted to be correct, complete or accurate.
Certain comments herein are based on current expectations and are considered “forward-looking statements.” These forward looking statements reflect assumptions and analyses made by the portfolio managers and Harris Associates L.P. based on their experience and perception of historical trends, current conditions, expected future developments, and other factors they believe are relevant. Actual future results are subject to a number of investment and other risks and may prove to be different from expectations. Readers are cautioned not to place undue reliance on the forward-looking statements.
The price-to-earnings ratio (“P/E”) compares a company’s current share price to its per-share earnings. It may also be known as the “price multiple” or “earnings multiple”, and gives a general indication of how expensive or cheap a stock is. Investors should not base investment decisions on any single attribute or characteristic data point.
The S&P 500 Index is a float-adjusted, capitalization-weighted index of 500 U.S. large-capitalization stocks representing all major industries. It is a widely recognized index of broad, U.S. equity market performance. Returns reflect the reinvestment of dividends. This index is unmanaged and investors cannot invest directly in this index.
Investing involves risk; principal loss is possible. There is no guarantee the Fund’s investment objective will be achieved. Value stocks may fall out of favor with investors and underperform growth stocks during given periods. The Fund’s portfolio tends to be invested in a relatively small number of stocks. As a result, the appreciation or depreciation of any one security held by the Fund will have a greater impact on the Fund’s net asset value than it would if the Fund invested in a larger number of securities. Although that strategy has the potential to generate attractive returns over time, it also increases the Fund’s volatility. These and other risk considerations are described in detail in the Fund’s prospectus.
All information provided is as of 12/31/2025 unless otherwise specified.