When I turned on my computer March 4, I was greeted with three pop-up alerts, “Oakmark Fund New All-Time High NAV,” “Oakmark Select Fund New All-Time High NAV,” and “Oakmark Equity and Income Fund New All-Time High NAV.” These are my favorite alerts and I’ve seen them quite frequently over the past year. Performance measurement is becoming such a sophisticated endeavor, why would I bother looking at something as simple as a new high? The S&P 500 Index has also been achieving new highs, so does it even matter?
When I started in the investment business in the 1980s, performance reporting was pretty simple: “Your portfolio increased in value last year by X%.” The bigger “X” was, the happier the client. Today, “X” is compared to numerous indexes and factor bets. The path to get to “X” is examined with a focus on risk metrics, such as tracking error, standard deviation, Sharpe ratio and so on. Investors are told they would have been better off with a number much smaller than “X” if it was achieved with low tracking error and low day-to-day volatility.
How Oakmark’s value philosophy can control risk
At Oakmark, we keep it simple by focusing on what matters most to our shareholders. Though they want to grow their capital, our shareholders worry most about losing money. So, we think about managing risk as trying to reduce the amount of principal that will be lost in bad markets.
That takes me to the three things we look for in each Oakmark investment, each of which we believe increases return potential while reducing risk.
- We want to buy a stock when it is selling at a large discount to our estimate of business value. If the price-to-value ratio eventually moves toward 1.0, and our estimate of business value increased, our gain from holding the stock is greater than the increase in business value. Likewise, when it turns out we were wrong and we have to lower our estimate of value, if the price-to-value gap closes, our loss on the stock is less than the decrease in our estimate of value.
- We also look for companies that are expected to produce a combination of growth plus dividend yield that exceeds what’s expected for the average business. If growth plus yield exceeds average, then we believe that our risk of loss decreases with time.
- And finally, we want to invest with management that is attempting to maximize long-term business value per share. We believe that reduces the risk that an action will be taken, such as an overpriced acquisition, that increases the size of the business but reduces per share value.
When we look at our performance, we have four goals:
- First, we want to increase our shareholders’ capital meaningfully more than inflation.
- Second (and third), we want to end up with more capital than would have been achieved had our shareholder purchased an index fund. This divides into two goals because we want to beat the return on the Russell 1000 Value Index, which like Oakmark uses a value philosophy, but also over long periods we want to beat the S&P 500 Index.
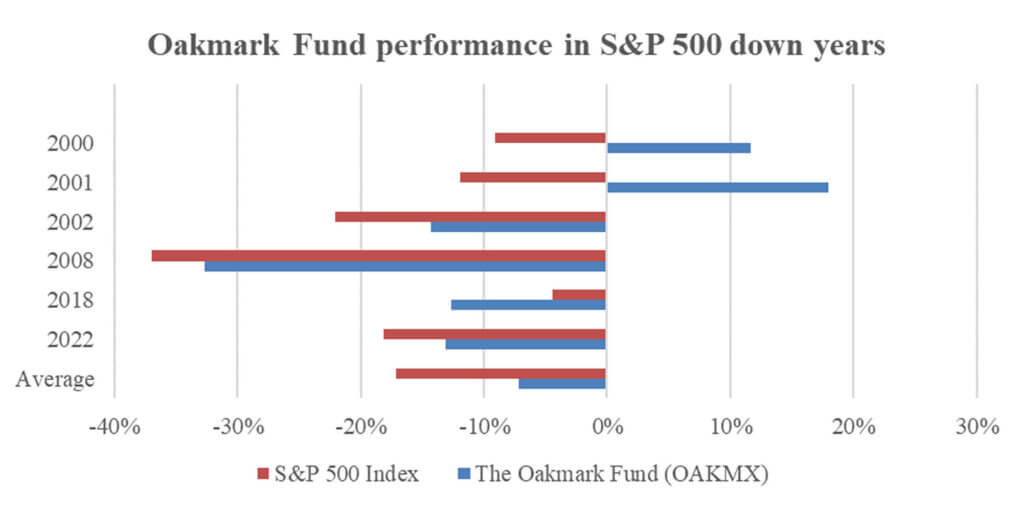
- Finally, goal number four is to lose less than the index when the S&P suffers large declines. Because most of our shareholders also own other mutual funds, and those funds tend to look more like the S&P 500 than Oakmark does, we want to make sure we aren’t our shareholders’ biggest problem when the rest of their portfolio is losing money.
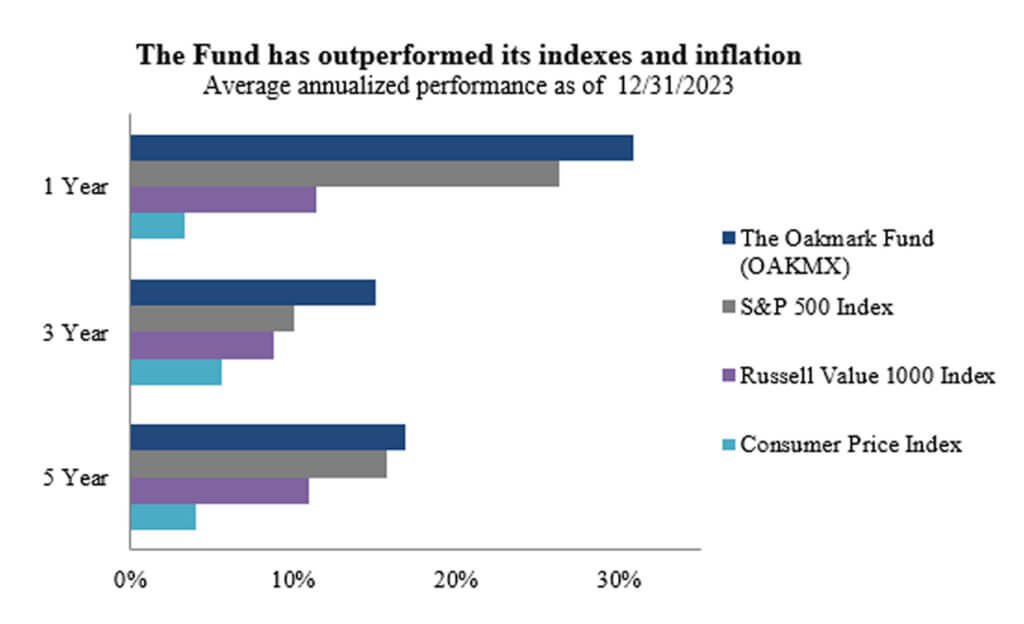
A look at our record is encouraging. Since the Fund’s inception in 1991, we have more than doubled the increase in the S&P 500 and the Russell 1000 Value Indexes, as well as increasing inflation adjusted capital by more than 20-fold (Chart 1). Although we don’t focus on recent performance because market cycles can overwhelm our stock picking, we have also outperformed both indexes as well as inflation over the past one, three and five years (Chart 2). Finally, there have been six years since we started Oakmark when the S&P 500 had a negative return. Oakmark lost less in five of those six years, with a median outperformance of 6 percentage points (Chart 3).
Focused on our shareholders
Two months into the new year, we are already frustrated because we are trailing the S&P 500, up only 4% versus up 7%. (I somewhat jokingly say that we would have preferred to have “saved” some of our late 2023 outperformance and applied it to 2024!) When the Russell Growth outperforms the Russell Value by 6 percentage points, as it has so far in 2024, and we own primarily traditional value, it is no surprise we are lagging. But, although a 7% return is clearly better than 4%, making 4% in two months is not too shabby, and is a good absolute return when inflation over those two months was about 0.5%.
That’s why I love to see my “Oakmark Fund New All-Time High” pop-up. It reminds me that the amount we lag or exceed the S&P 500 isn’t all that matters. Our shareholders have entrusted us with managing the money they are counting on for purchasing a home, sending kids to college and their retirement. Our shareholders are real people with real financial needs and goals. When the Fund hits a new high, I can smile knowing that all our shareholders have made money. That’s what really matters. Thanks to each of you for entrusting us with the important challenge of helping you meet your financial goals. We try to earn your trust every day.
Chart 1
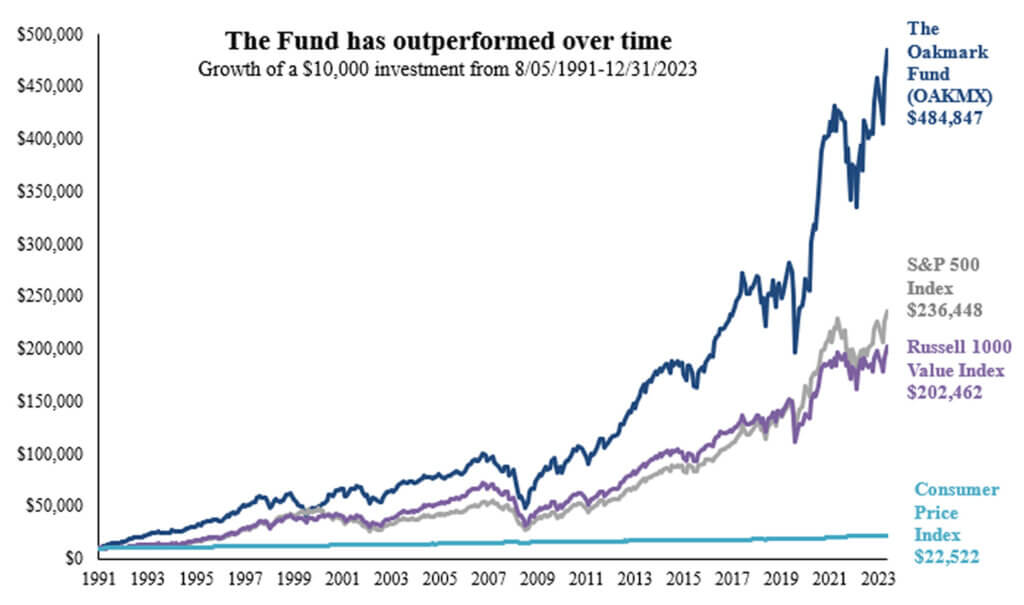
Past performance is no guarantee of future results. Current performance may be lower or higher than the performance data quoted. All returns reflect the reinvestment of dividends and capital gains and the deduction of transaction costs.
Chart 2
Since Fund inception. Past performance is no guarantee of future results. Current performance may be lower or higher than the performance data quoted. All returns reflect the reinvestment of dividends and capital gains and the deduction of transaction costs.
Chart 3
OPINION PIECE. PLEASE SEE ENDNOTES FOR IMPORTANT DISCLOSURES.
Average Annual Total Returns (as of 12/31/2023):
| Fund | 3 Month | 1 Year | 3 Year | 5 Year | 10 Year | Inception |
|---|---|---|---|---|---|---|
| OAKMX | 12.92% | 30.89% | 15.02% | 16.89% | 11.33% | 12.72% |
| S&P 500 Total Return Index | 11.69% | 26.29% | 10.00% | 15.69% | 12.03% | 10.25% |
Fund Inception: 08/05/1991
Expense Ratio: 0.91%
Expense ratios are as of the Fund’s most recent prospectus dated January 28, 2024; actual expenses may vary.
Returns for periods of less than one year are not annualized.
Past performance is no guarantee of future results. The performance data quoted represents past performance. Current performance may be lower or higher than the performance data quoted. The investment return and principal value vary so that an investor’s shares when redeemed may be worth more or less than the original cost.
To obtain most recent Oakmark Fund month-end performance data, view it here.
The information, data, analyses, and opinions presented herein (including current investment themes, the portfolio managers’ research and investment process, and portfolio characteristics) are for informational purposes only and represent the investments and views of the portfolio managers and Harris Associates L.P. as of the date written and are subject to change and may change based on market and other conditions and without notice. This content is not a recommendation of or an offer to buy or sell a security and is not warranted to be correct, complete or accurate.
Certain comments herein are based on current expectations and are considered “forward-looking statements.” These forward-looking statements reflect assumptions and analyses made by the portfolio managers and Harris Associates L.P. based on their experience and perception of historical trends, current conditions, expected future developments, and other factors they believe are relevant. Actual future results are subject to a number of investment and other risks and may prove to be different from expectations. Readers are cautioned not to place undue reliance on the forward-looking statements.
NAV stands for Net Asset Value. NAV is the dollar value of a single mutual fund share, based on the value of the underlying assets of the fund minus its liabilities divided by the number of shares outstanding.
Standard Deviation is a measure of the degree to which a portfolio’s return varies from its previous returns, or from the average of all similar portfolios. The larger the standard deviation, the greater the likelihood (and risk) that a security’s performance will fluctuate from the average return.
The Sharpe ratio seeks to characterize how well the return of an asset compensates the investor for the risk taken.
The Price to Value for a stock is the ratio of the current stock price divided by the intrinsic value as calculated by the investment team’s valuation model. The Price to Value for a portfolio is the weighted average of the price to value for each stock in the portfolio.
The Consumer Price Index (CPI) is a measure of the average change over time in the prices paid by urban consumers for a market basket of consumer goods and services. The CPI is the most widely used measure of inflation and is sometimes viewed as an indicator of the effectiveness of government economic policy.
The S&P 500 Total Return Index is a float-adjusted, capitalization-weighted index of 500 U.S. large-capitalization stocks representing all major industries. It is a widely recognized index of broad, U.S. equity market performance. Returns reflect the reinvestment of dividends. This index is unmanaged and investors cannot invest directly in this index.
The Russell 1000® Value Index measures the performance of the large-cap value segment of the U.S. equity universe. It includes those Russell 1000® companies with lower price-to-book ratios and lower expected growth values. This index is unmanaged and investors cannot invest directly in this index.
Russell 1000® Growth Index is an unmanaged index that measures the performance of the large-cap growth segment of the U.S. equity universe. It includes those Russell 1000® companies with higher price-to-book ratios and higher forecasted growth values. This index is unmanaged and investors cannot invest directly in this index.
The Fund’s portfolio tends to be invested in a relatively small number of stocks. As a result, the appreciation or depreciation of any one security held by the Fund will have a greater impact on the Fund’s net asset value than it would if the Fund invested in a larger number of securities. Although that strategy has the potential to generate attractive returns over time, it also increases the Fund’s volatility.
Investing in value stocks presents the risk that value stocks may fall out of favor with investors and underperform growth stocks during given periods.
All information provided is as of 12/31/2023 unless otherwise specified.
Before investing in any Oakmark Fund, you should carefully consider the Fund’s investment objectives, risks, management fees and other expenses. This and other important information is contained in a Fund’s prospectus and summary prospectus. Please read the prospectus and summary prospectus carefully before investing. For more information, please visit Oakmark.com or call 1-800-OAKMARK (1-800-625-6275).