Oakmark Fund - Investor Class
Average Annual Total Returns 03/31/2025
Since Inception 08/05/91 12.76%
10-year 11.96%
5-year 23.71%
1-year 6.71%
3-month 1.14%
Expense Ratio: 0.89%
Expense ratios are as of the Fund’s most recent prospectus dated January 28, 2025, as amended and restated January 30, 2025 and March 14, 2025; actual expenses may vary.
Past performance is no guarantee of future results. The performance data quoted represents past performance. Current performance may be lower or higher than the performance data quoted. The investment return and principal value vary so that an investor’s shares when redeemed may be worth more or less than the original cost. To obtain the most recent month-end performance data, view it here.
This commentary was written on March 31. Rarely does enough change in a few trading days to merit an update, but it has been quite a week! The S&P 500 fell nearly 11% in two days following the “Liberation Day” tariff announcements. We will have more to say on tariffs soon, but like most investors and economists, we are skeptical of their ability to increase business values, and hope the ultimate outcome is less extreme than what has been announced so far. Having said that, nothing changes in the sentiment of the report that follows.
For much of the past decade, the S&P 500 has been a very difficult benchmark to beat due to its concentration in mega-cap technology companies that have performed much better than the rest of the market. Yet, in the first quarter of 2025, the so-called “Magnificent Seven” (Alphabet, Amazon, Apple, Meta, Microsoft, Nvidia and Tesla) declined an average of 16%. In fact, the return on the average Magnificent Seven stock has been negative since early July 2024 and is down 20% since its December peak. That’s the pattern in investing: Once everyone is talking about how great an investment is, it is usually no longer that great.
Stock market corrections
After the first 50 days of 2025, the S&P 500 was up 4% for the year, sitting at 6,144, a new all-time high. Commentators generally credited the strength to excitement concerning the new president. Sixteen short trading days later, on March 13, the S&P closed at 5,522, down 10% from the peak. Commentators generally blamed the decline on fear concerning the new president. Oakmark shareholders know that we believe economic forces are stronger and longer lasting than political forces, and we reject the idea that either party has a monopoly on strong stock market performance.
The financial media’s response to the market’s decline was predictable. When the decline reached 10%, warnings blared that the market was now in a “correction,” a term that is generally used for a fall of at least 10% from a recent high. Corrections tend to occur every couple of years, and the message from the media is always, “Now that the market is down 10%, you should start to be scared and become more cautious.” As usual, that’s a day late and a dollar short.
If it feels like you read a “Don’t Panic in a Correction” commentary from me every couple of years, that’s because that timing is about right. So, spoiler alert, the analysis that follows will lead to the same conclusion it always has – don’t panic sell after corrections!
It never fails that after the market falls, shareholders write in to ask if they should sell now before the situation gets worse. Study after study shows that the average mutual fund investor performs worse than the funds they invest in because they buy after prices go up and sell after prices go down. Research firms such as Dalbar have found that self-destructive behavior has cost investors between one and two percentage points of return per year. Yet, the behavior persists.
We don’t try to market time when managing the Oakmark funds, and we encourage you not to waste your energy in that pursuit. Instead, consider rebalancing your portfolio. Rebalancing probably won’t improve your returns, but might reduce risk and help you avoid the buy-high, sell-low trap. Rebalancing involves trimming your holdings that have gone up in value and account for a larger percentage of your portfolio than you had previously decided was appropriate. It also means adding to positions that have declined because your risk tolerance allows you to restore them to a higher portfolio weighting.
The first-quarter 2025 correction followed 20 previous S&P 500 declines of 10% from all-time highs in the past 50 years. The most recent two were in the first quarters of 2020 and 2022, and both became bear markets (generally agreed to be a 20% decline), falling 34% and 24%, respectively. The 2020 decline was in response to the economic damage done by locking down much of the world for a once-in-a-century pandemic, and the 2022 decline was due to the combination of economic slowdown (two consecutive quarters of lower GDP that wasn’t deemed a recession) and the highest inflation we’d seen in 40 years. Those two stock market declines were not typical of corrections. In fact, only four more of the other 18 corrections declined a second 10% to reach the bear market threshold.
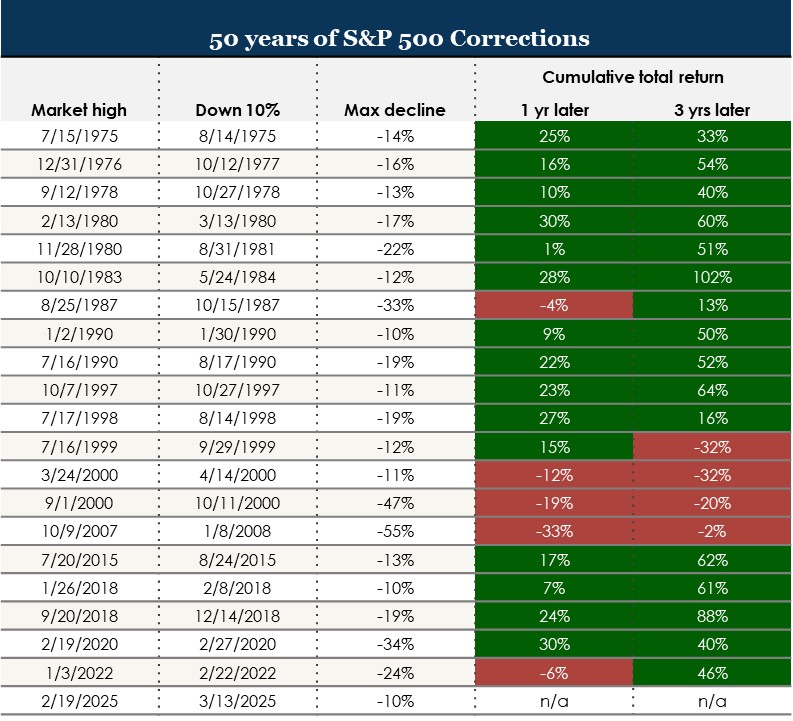
Past performance does not indicate future results. Chart above does not represent any Harris Oakmark product or strategy. Data as of 3/17/2025. Index source: FactSet for returns after 1/4/1988. Multiple for dividend yields which are used to estimate total returns from 1/2/1975 through 1/4/1988. Returns are calculated using estimated total returns from 1/2/1975 through 1/4/1988 due to data availability. Estimated total returns are calculated by taking the daily price return plus the monthly dividend yield / 365. Dividend yield data was sourced from Multiple. Returns after 1/4/1988 use the total return index following the initial period of decline of 10% or more and are not annualized.
Over the past 50 years, how did an investor fare who bravely stepped in and purchased the S&P 500 after a 10% decline? Note that this doesn’t mean they perfectly timed the bottom of the correction, which is unknowable until after the fact. Rather, this hypothetical investor bought right after the first decline of 10%. In 75% of the cases, the investor had a profitable position after a year, generating an average return of 11%. And three years after the purchase, the average return was 37%.
One oddity in these numbers is that while corrections typically occur every two to three years, around the peak of the dot-com bubble, in 1999 and 2000, the market fell by 10% on three separate occasions and then recovered to a slightly higher high before the bubble completely popped in late 2000, cutting the S&P 500 nearly in half. Because those three declines occurred so close together, the big dot-com bear market is effectively triple weighted in our averages. If we reduce its impact by looking at median returns, the one- and three-year gains following a 10% decline increase to 15% and 48%, respectively. If an investor had purchased the S&P 500 at each month-end during the past 50 years and held their position for one or three years, their median returns would have been 14% and 43%, respectively. Contrary to the advice to be more cautious because the market is down, there is no evidence that prospective returns are worse after corrections.
Though we aren’t market timers at Oakmark, we are fans of periodic portfolio rebalancing. We think it makes sense to set target portfolio weightings for stocks, bonds and cash, and within the stock portion, to further target U.S. and international exposure. Especially after large moves, it is possible to take advantage of volatility by trimming the outperforming categories and adding to the underperforming ones. This can help prevent an ever-increasing exposure to one asset as its price gets more and more expensive. Further, it establishes the pattern that you can take advantage of inevitable periods of weakness to increase your holdings in undervalued assets. This behavior goes a long way toward reducing, if not eliminating, the counterproductive temptation to sell after declines.
Owning pro sports teams
Having grown up a baseball fan in Minnesota, I’ve always followed the Minnesota Twins. So it caught my eye last month when The Athletic broke the story that the Twins were for sale at a debt-adjusted value of $2.1 billion. The Twins were purchased by the current owner in 1984 for just $44 million. At the current asking price, that investment has increased an amazing 48-fold in under 41 years. The incredible returns from pro sports franchises leave most of us shaking our heads, annoyed that we had neither the money nor the foresight to profit from them.
Out of curiosity, I calculated what a passive investor would have earned during that same time period, buying $44 million of an S&P 500 index fund in June 1984 and holding until March of 2025. Amazingly, that investment would have grown to $3.9 billion, much more than the return from the Twins! The stock market achieved that return without requiring any work or creating any unwanted publicity. Plus, it provided the very beneficial advantages of daily pricing and easy liquidity. And a sidenote: Had that investor moved from the S&P 500 to the Oakmark Fund when it started in 1991, they would have over $8 billion today!
Leaving an S&P 500 investment untouched for 41 years requires some intestinal fortitude, considering everything that went wrong in the world over that time. If you are thinking that the problems today look more foreboding, I’d encourage you to look back at a couple of previous commentaries I wrote about how challenging the news environment was for the long-term investor. Yet, the market kept increasing. In those reports, I listed some of the issues that most alarmed investors each year going back to the 1991 launch of the Oakmark Fund (September 2016 Commentary and March 2022 Commentary). Though it’s an intimidating list, the long-term rewards for not panicking when the stock market went down have been well worth it. We have no reason to expect that to change.
OPINION PIECE. PLEASE SEE ENDNOTES FOR IMPORTANT DISCLOSURES.
The securities mentioned above comprise the following percentages of the Oakmark Fund’s total net assets as of 03/31/2025: Alphabet 3.2%, Amazon 0%, Apple 0%, Meta 0%, Microsoft 0%, Nvidia 0% and Tesla 0%. Portfolio holdings are not intended as recommendations of individual stocks and are subject to change. The Funds disclaim any obligation to advise shareholders of such changes. Information about portfolio holdings does not represent a recommendation or an endorsement to Fund shareholders or other members of the public to buy or sell any security contained in the Funds’ portfolios. Portfolio holdings are current to the date listed but are subject to change any time. There are no assurances that the securities will remain in the Funds’ portfolios after the date listed or that the securities that were previously sold may not be repurchased.
Access the full list of holdings for the Oakmark Fund here.
The information, data, analyses, and opinions presented herein (including current investment themes, the portfolio managers’ research and investment process, and portfolio characteristics) are for informational purposes only and represent the investments and views of the portfolio managers and Harris Associates L.P. as of the date written and are subject to change and may change based on market and other conditions and without notice. This content is not a recommendation of or an offer to buy or sell a security and is not warranted to be correct, complete or accurate.
Certain comments herein are based on current expectations and are considered “forward-looking statements.” These forward looking statements reflect assumptions and analyses made by the portfolio managers and Harris Associates L.P. based on their experience and perception of historical trends, current conditions, expected future developments, and other factors they believe are relevant. Actual future results are subject to a number of investment and other risks and may prove to be different from expectations. Readers are cautioned not to place undue reliance on the forward-looking statements.
This material is not intended to be a recommendation or investment advice, does not constitute a solicitation to buy, sell or hold a security or an investment strategy, and is not provided in a fiduciary capacity. The information provided does not take into account the specific objectives or circumstances of any particular investor, or suggest any specific course of action. Investment decisions should be made based on an investor’s objectives and circumstances and in consultation with his or her financial professionals.
The Oakmark Funds’ portfolios tend to be invested in a relatively small number of securities. As a result, the appreciation or depreciation of any one security held by the Fund will have a greater impact on the Fund’s net asset value than it would if the Fund invested in a larger number of securities. Although that strategy has the potential to generate attractive returns over time, it also increases the Fund’s volatility.
Investing in value stocks presents the risk that value stocks may fall out of favor with investors and underperform growth stocks during given periods.
All information provided is as of 03/31/2025 unless otherwise specified.