Oakmark Fund - Investor Class
Average Annual Total Returns 09/30/16
Since Inception 08/05/91 12.51%
10-year 8.50%
5-year 16.64%
1-year 14.36%
3-month 8.53%
Gross Expense Ratio as of 09/30/15 was 0.85%
Past performance is no guarantee of future results. The performance data quoted represents past performance. Current performance may be lower or higher than the performance data quoted. The investment return and principal value vary so that an investor’s shares when redeemed may be worth more or less than the original cost. To obtain the most recent month-end performance data, view it here.
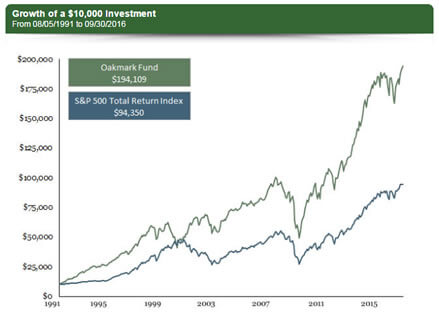
This quarter marks the 25th anniversary of the Oakmark Fund, and we are proud of our long-term results and pleased to mark the occasion with an all-time high adjusted NAV at quarter end. As you can see from the Growth of a $10,000 Investment chart (see chart below), a $10,000 investment in the Oakmark Fund in August 1991 has appreciated to $194,000 as of the end of this quarter, which is more than twice the appreciation level of the S&P 500 over the same time period. This represents an average annual total return of 13% for the Oakmark Fund and 9% for the S&P 500.
We’re investing the same way today as we did 25 years ago. The Oakmark Fund’s first quarterly report in 1991 mentioned the following principles: invest in companies selling below long-term intrinsic value, take advantage of irrational and short-term investor thinking, and invest with companies that have owner-oriented management teams. We have a great team of investment analysts who use these principles to find attractive investment opportunities for the Oakmark portfolio. It is an honor to manage the Oakmark Fund, and we want to thank you for your support and confidence. We look forward to continuing this tradition for the next 25 years and beyond.
The Oakmark Fund increased 9% during the recent quarter, bringing the increase to 14% for the fiscal year ended September 30. The S&P 500 increased 4% for the quarter and increased 15% for the fiscal year. This was a very good quarter for the Oakmark Fund, with strong performance from our highest weighted sectors. For some time we have believed that businesses with a narrower range of outcomes, or stable businesses, have been bid-up as bond substitutes, while businesses with a more cyclical profile have fallen to more attractive valuation levels. In the third quarter, that positioning paid off for the Oakmark Fund. For the quarter, Information Technology and Financials were our highest contributing sectors, and Health Care and Consumer Staples, two of our lowest weighted areas, were our weakest performers.
For the full fiscal year, Information Technology and Industrials were our best performers, and Consumer Staples and Health Care were our weakest. Our highest contributing securities for the year were Apache and Texas Instruments, and our worst performers were American Express and Liberty Interactive QVC. For the recent quarter, Bank of America and Qualcomm were our best contributors, and our weakest were Liberty Interactive QVC and General Electric Company. We added one new name to the portfolio during the quarter (see below), and we eliminated our positions in LinkedIn and Monsanto after they received acquisition offers.
MGM Resorts International (MGM – $26)
We believe there are many ways to achieve strong returns from an investment in MGM Resorts International. MGM is a recovery story, driven by improving supply and demand in Las Vegas where MGM has significant exposure. The company’s Profit Growth Plan, which is a cost-cutting and revenue enhancement program, should lead to higher profitability and allow for significant operating leverage once sales recover. From a longer term perspective, we believe MGM will benefit from its increasing geographic diversity, strong property development pipeline and improving capital structure. We think that valuing MGM on a property-by-property basis using cash flow multiples from recent transactions produces a much higher value than the current stock price indicates.
The holdings mentioned above comprise the following percentages of the Oakmark Fund’s total net assets as of 09/30/16: Apache Corp. 3.2%, Texas Instruments Inc. 2.4%, American Express Co. 0.0%, Liberty Interactive Corp. QVC Group Class A 1.6%, Bank of America Corp. 3.4%, QUALCOMM Inc. 2.2%, General Electric Co. 2.8%, LinkedIn Corp. 0%, Monstanto Co. 0% and MGM Resorts International 1.1%. Portfolio holdings are subject to change without notice and are not intended as recommendations of individual stocks.
Click here to access the full list of holdings for The Oakmark Fund as of the most recent quarter-end.
The S&P 500 Total Return Index is a market capitalization-weighted index of 500 large-capitalization stocks commonly used to represent the U.S. equity market. All returns reflect reinvested dividends and capital gains distributions. This index is unmanaged and investors cannot invest directly in this index.
The Oakmark Fund’s portfolio tends to be invested in a relatively small number of stocks. As a result, the appreciation or depreciation of any one security held by the Fund will have a greater impact on the Fund’s net asset value than it would if the Fund invested in a larger number of securities. Although that strategy has the potential to generate attractive returns over time, it also increases the Fund’s volatility.
The discussion of the Fund’s investments and investment strategy (including current investment themes, the portfolio managers’ research and investment process, and portfolio characteristics) represents the Fund’s investments and the views of the portfolio managers and Harris Associates L.P., the Fund’s investment adviser, at the time of this letter, and are subject to change without notice.